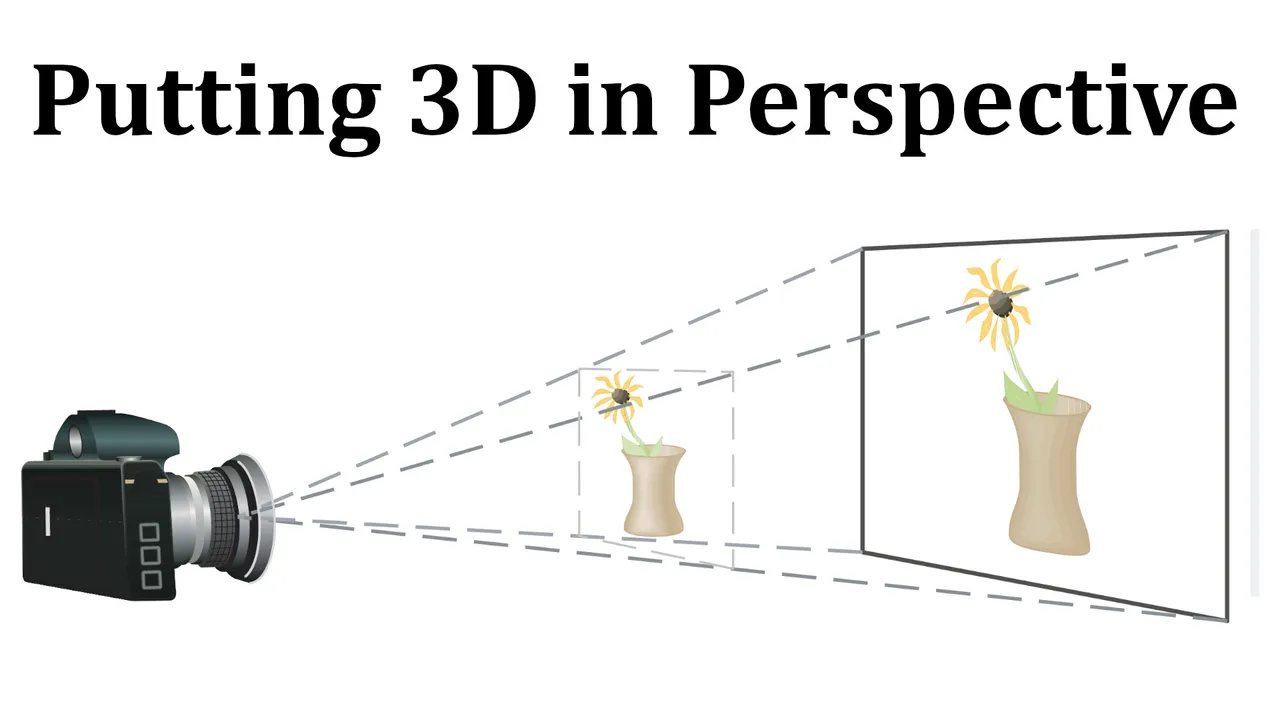
In this video I go over the mathematics involved in computer graphics programming in order to clip and project a 3D image onto a 2D screen while still maintaining 3D perspective. This was taken from my Stewart Calculus book in the Laboratory Project titled Putting 3D in Perspective. Computer graphics programmers have to somehow display 3D images stored in memory onto a 2D screen for users to observe. To do this, the 3D images need to be projected from a point at which the camera or eye is viewing and then onto a 2D screen behind the object, while maintaining perspective. To do this, the equations of 4 clipping planes are first needed to be obtained to clip off the portions of image that will be beyond the projection. In this Project, I derive the clipping plane equations, as well as equations of a 3D line and 3D rectangle, and their their projected formulas. I also go over the concept of "hidden line rendering" to remove objects that are behind other 3D objects, thus saving computing power by not needing to project them onto the screen. And as always, I use the amazing GeoGebra 3D graphing calculator to plot out all the projections, and which you can play around with in this link: https://www.geogebra.org/calculator/twezjbu5
The topics covered as well as their timestamps are listed below.
Introduction: 0:00
Calculus Book Reference: 1:00
Sections in Calculus Book Chapter: 1:14
Topics to Cover: 2:02
Laboratory Project: Putting 3D in Perspective: 2:54
- 4 Questions: 5:03
Question 1: 8:10
- Equation of the 3D line: 13:00
- Equation of the Right Clipping Plane: 18:22
- Equation of the Top Clipping Plane: 38:49
- Equation of the Left Clipping Plane: 53:15
- Equation Bottom Clipping Plane: 1:04:55
- Summary: 1:09:10
Question 2: 1:10:54
- Projecting 3D on to 2D: 1:12:13
Question 3: 1:27:31
Question 4: 1:29:39
- Point of Intersection of the Line and Rectangle: 1:36:56
- Point of Intersection of the Projected Line and Projected Rectangle: 2:04:43
- Graphing it All Out in GeoGebra 3D Graphing Calculator: 2:20:10
Outro: 2:23:31
PDF video notes: https://1drv.ms/b/s!As32ynv0LoaIirBjY_SU7z2CXBOG1A
Video sections playlist: https://www.youtube.com/playlist?list=PLai3U8-WIK0ElsrMs_IBprUoHocIwyAmK
Full Vectors and the Geometry of Space series: https://www.youtube.com/playlist?list=PLai3U8-WIK0FjJpwnxwdrOR7L8Ul8VZoZ
Watch video on:
- 3Speak:
- Odysee: https://odysee.com/@mes:8/Laboratory-Project-Putting-3D-in-Perspective:0
- BitChute:
- Rumble: https://rumble.com/v3q97gl-laboratory-project-putting-3d-in-perspective.html
- DTube:
- YouTube:

View Video Notes Below!
Download these notes: Link is in video description.
View these notes as an article: @mes
Subscribe via email: http://mes.fm/subscribe
Donate! :) https://mes.fm/donate
Buy MES merchandise! https://mes.fm/store
More links: https://linktr.ee/matheasy
Follow my research in real-time on my MES Links Telegram: https://t.me/meslinks
Subscribe to MES Truth: https://mes.fm/truthReuse of my videos:
- Feel free to make use of / re-upload / monetize my videos as long as you provide a link to the original video.
Fight back against censorship:
- Bookmark sites/channels/accounts and check periodically
- Remember to always archive website pages in case they get deleted/changed.
Recommended Books:
- "Where Did the Towers Go?" by Dr. Judy Wood: https://mes.fm/judywoodbook
Join my forums!
- Hive community: created/hive-128780
- Reddit: https://reddit.com/r/AMAZINGMathStuff
- Discord: https://mes.fm/chatroom
Follow along my epic video series:
- #MESScience: https://mes.fm/science-playlist
- #MESExperiments: @mes/list
- #AntiGravity: @mes/series
-- See Part 6 for my Self Appointed PhD and #MESDuality breakthrough concept!- #FreeEnergy: https://mes.fm/freeenergy-playlist
- #PG (YouTube-deleted series): @mes/videos
NOTE #1: If you don't have time to watch this whole video:
- Skip to the end for Summary and Conclusions (if available)
- Play this video at a faster speed.
-- TOP SECRET LIFE HACK: Your brain gets used to faster speed!
-- MES tutorial: @mes/play-videos-at-faster-or-slower-speeds-on-any-website- Download and read video notes.
- Read notes on the Hive blockchain $HIVE
- Watch the video in parts.
-- Timestamps of all parts are in the description.Browser extension recommendations:
- Increase video speed: https://mes.fm/videospeed-extension
- Increase video audio: https://mes.fm/volume-extension
- Text to speech: https://mes.fm/speech-extension
--Android app: https://mes.fm/speech-android
Vectors and the Geometry of Space: Equations of Lines and Planes
Calculus Book Reference
Note that I mainly follow along the following calculus book:
- Calculus: Early Transcendentals 7th Edition by James Stewart
- Note: In the earlier videos I used the 6th edition.
Sections in Calculus Book Chapter
I have made a list of the sections in this particular chapter with links to the Hive post of the videos I have already finished.
Note that I have started splitting each long video into sections and made a playlist for each.
Vectors and the Geometry of Space
- 3-D Coordinate Systems
- Vectors
- The Dot Product
- The Cross Product
- Equations of Lines and Planes
- Playlist
- Laboratory Project: Putting 3D in Perspective (Current Video)
- Cylinders and Quadric Surfaces
- Review
- True-False Quiz
- Problems Plus
Topics to Cover
Note that the timestamps will be included in the video description for each topic listed below.
- Laboratory Project: Putting 3D in Perspective
- 4 Questions
- Question 1
- Equation of the 3D Line
- Equation of the Right Clipping Plane
- Equation of the Top Clipping Plane
- Equation of the Left Clipping Plane
- Equation Bottom Clipping Plane
- Summary
- Question 2
- Projecting 3D on to 2D
- Question 3
- Question 4
- Point of Intersection of the Line and Rectangle
- Point of Intersection of the Projected Line and Projected Rectangle
- Graphing it All Out in GeoGebra 3D Graphing Calculator
Laboratory Project: Putting 3D in Perspective
Computer graphics programmers face the same challenge as the great painters of the past:
How to represent a three-dimensional scene as a flat image on a two-dimensional plane (a screen or a canvas).
To create the illusion of perspective, in which closer objects appear larger than those farther away, three-dimensional objects in the computer's memory are projected onto a rectangular screen window from a viewpoint where the eye, or camera, is located.
The viewing volume - the portion of space that will be visible - is the region contained by the four planes that pass through the viewpoint and an edge of the screen window.
If objects in the scene extend beyond these four planes, they must be truncated before pixel data are sent to the screen.
These planes are therefore called clipping planes.
Question 1
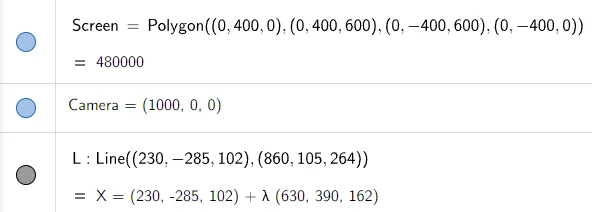
Suppose the screen is represented by a rectangle in the yz-plane with vertices (0, ±400, 0) and (0, ±400, 600), and the camera is placed at (1000, 0, 0).
A line L in the scene passes through the points (230, -285, 102) and (860, 105, 264).
At what points should L be clipped by the clipping planes?
Question 2
If the clipped line segment is projected on the screen window, identify the resulting line segment.
Question 3
Use parametric equations to plot the edges of the screen window, the clipped line segment, and its projection on the screen window.
Then add sight lines connecting the viewpoint to each end of the clipped segments to verify that the projection is correct.
Question 4
A rectangle with vertices (621, -147, 206), (563, 31, 242), (657, -111, 86), and (599, 67, 122) is added to the scene.
The line L intersects this rectangle.
To make the rectangle appear opaque, a programmer can use hidden line rendering, which removes portions of objects that are behind other objects.
Identify the portion of L that should be removed.
Question 1
Suppose the screen is represented by a rectangle in the yz-plane with vertices (0, ±400, 0) and (0, ±400, 600), and the camera is placed at (1000, 0, 0).
A line L in the scene passes through the points (230, -285, 102) and (860, 105, 264).
At what points should L be clipped by the clipping planes?
Solution:
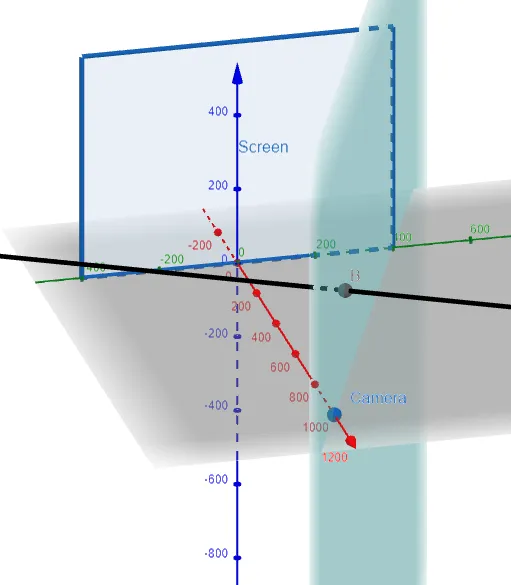
Let's first graph out the information we are given using the amazing GeoGebra 3D graphing calculator.
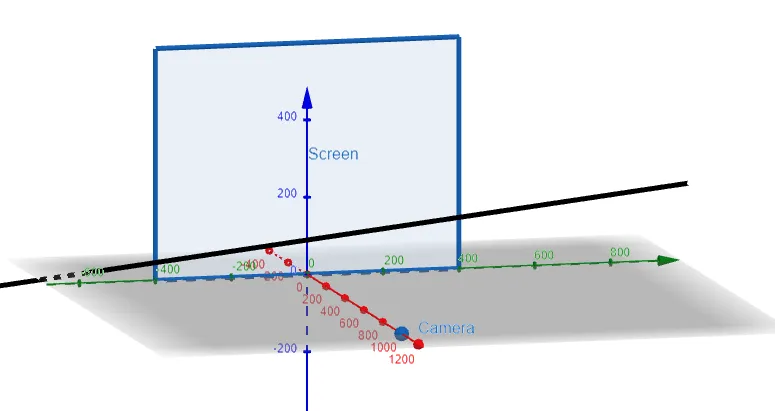
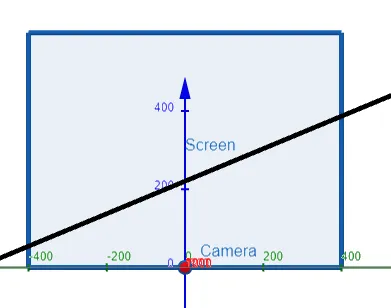
Thus we need to determine the points on L which are beyond the projected planes from the camera to the edges of the screen, and hence need to be "clipped" out.
This means we need to determine the 4 clipping planes, which we can see below.
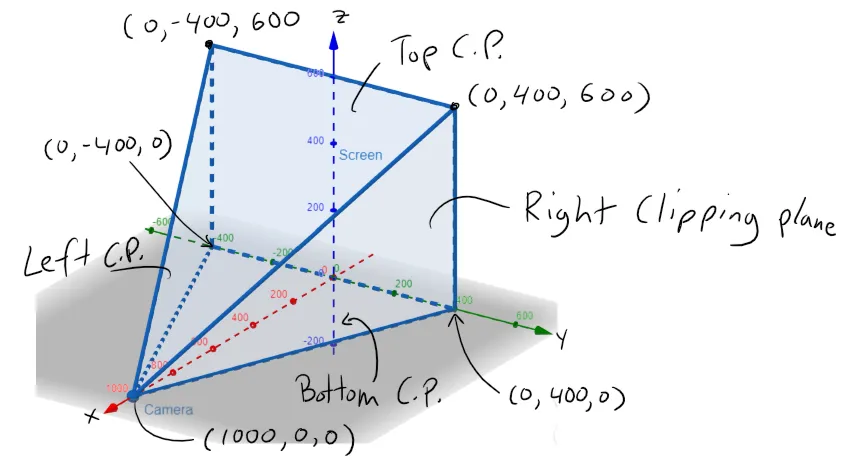
Next, we will need to determine the equations of the Line and the Clipping Planes.
Recall the equation of Lines & Planes.
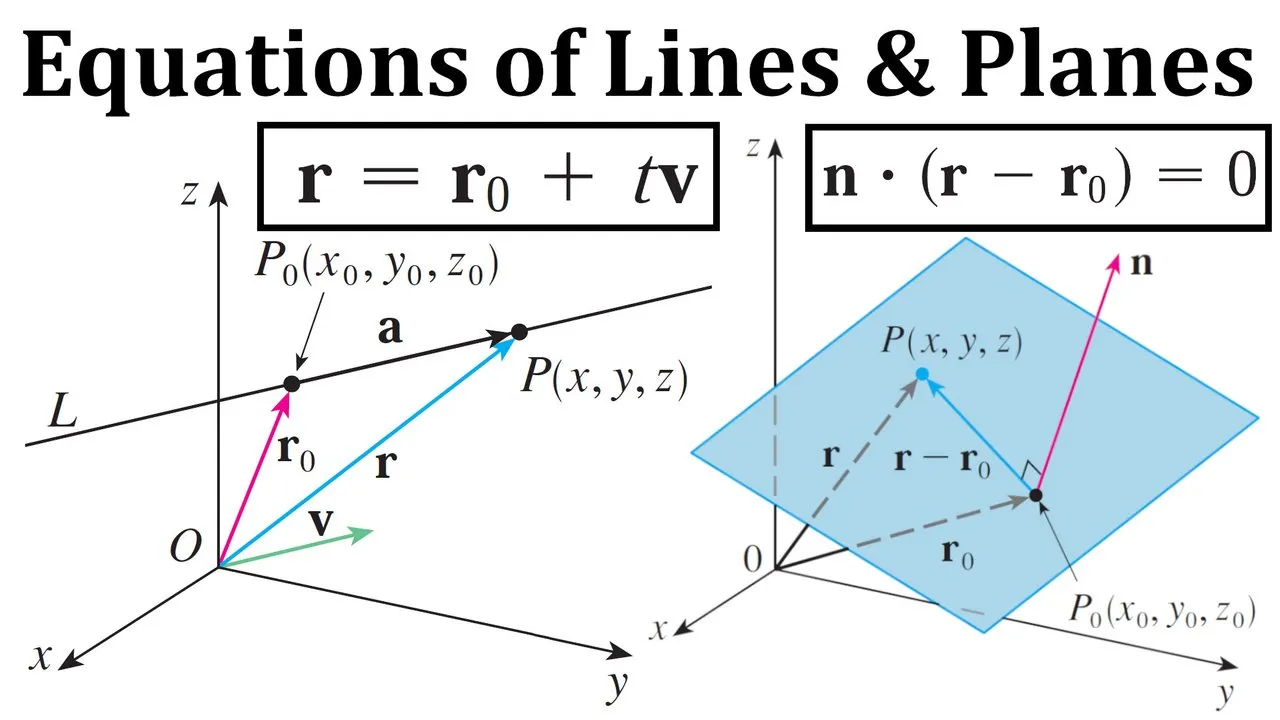
Equation of the 3D Line
Using the given two points of the line, we can thus determine the vector equation of the line and then the parametric equations of the line:

Equation of the Right Clipping Plane
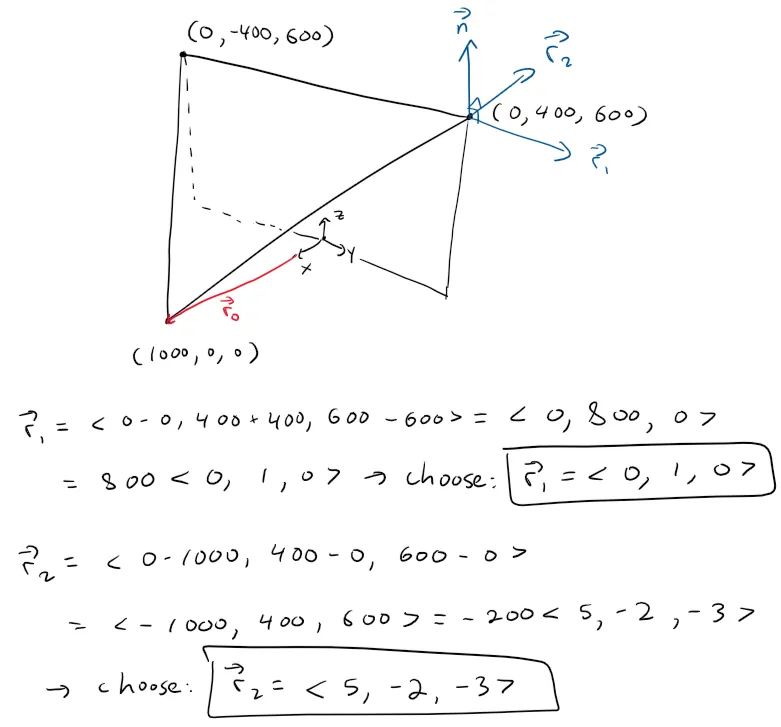
The right clipping plane can be determined by first obtaining its normal vector, which can be determined as the cross product of the line that extends from the Camera to a corner and the vertical line connecting that corner.
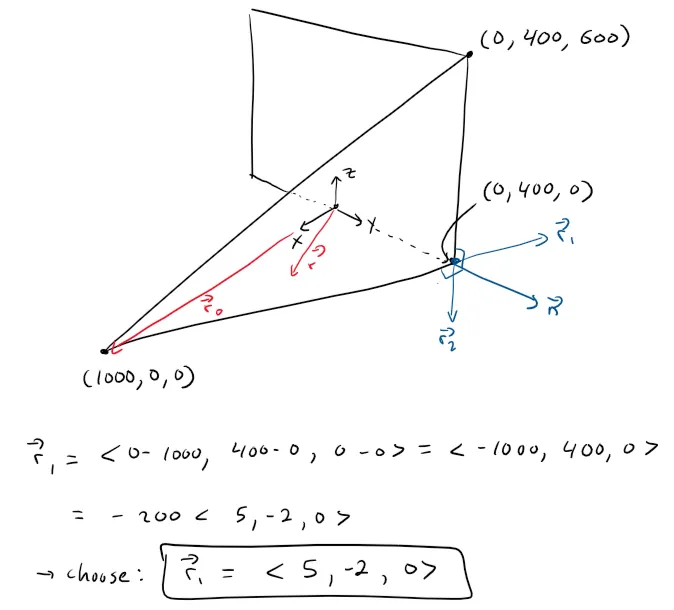
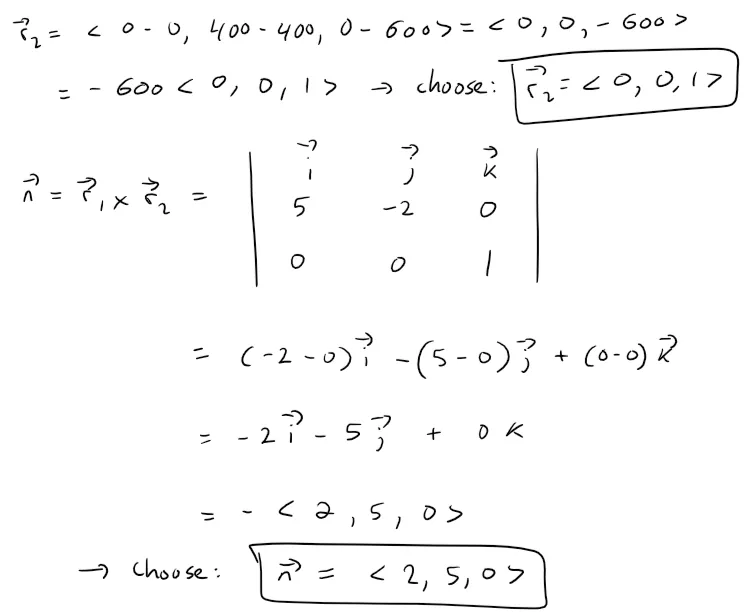
Note that I chose the simplified vectors since all that is important is the direction of the vectors and not the magnitude or sign.
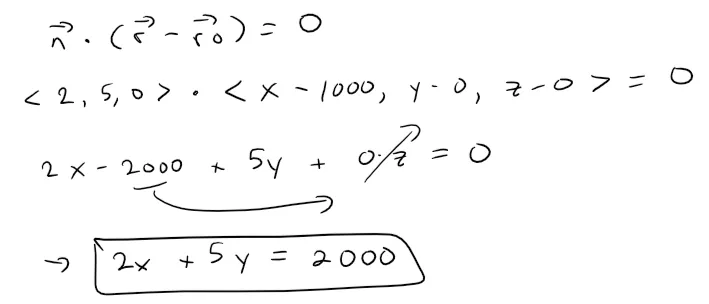
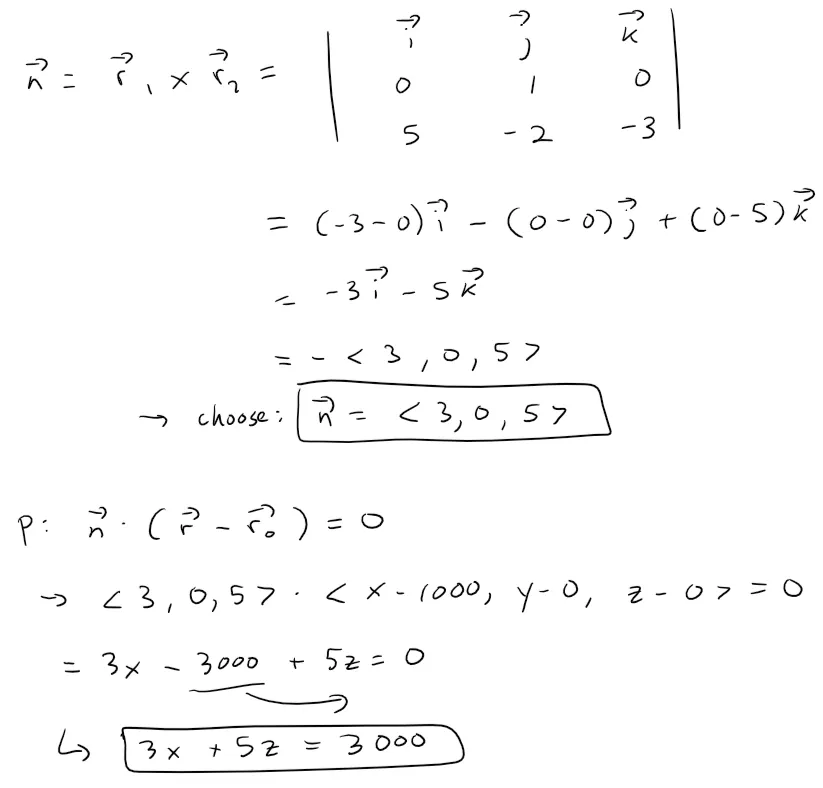
Now we can plug in the normal vector and a point on the plane into the vector equation of a plane to determine the linear equation of the right clipping plane.
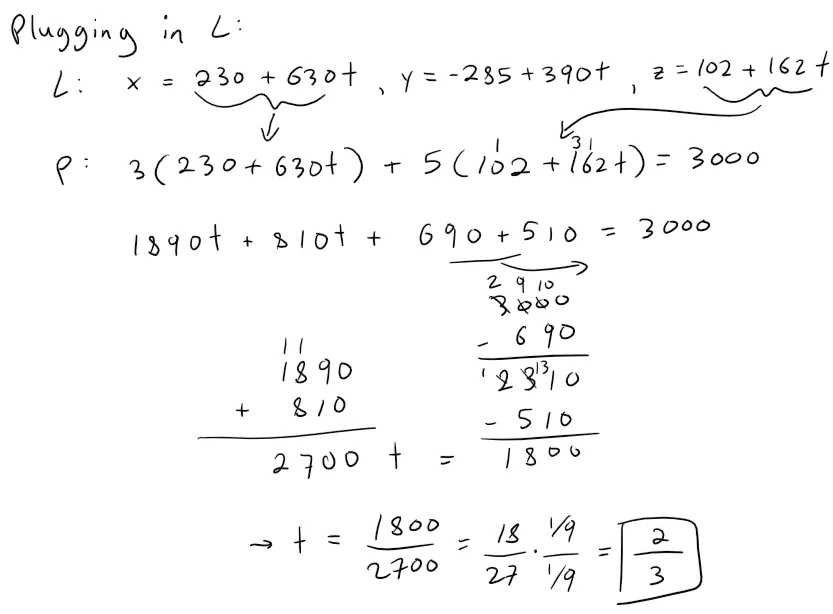
Now we need to determine if the line L crosses the right clipping plane by plugging in our parametric equations of a line into the linear equation of a plane and solving for the parameter t.
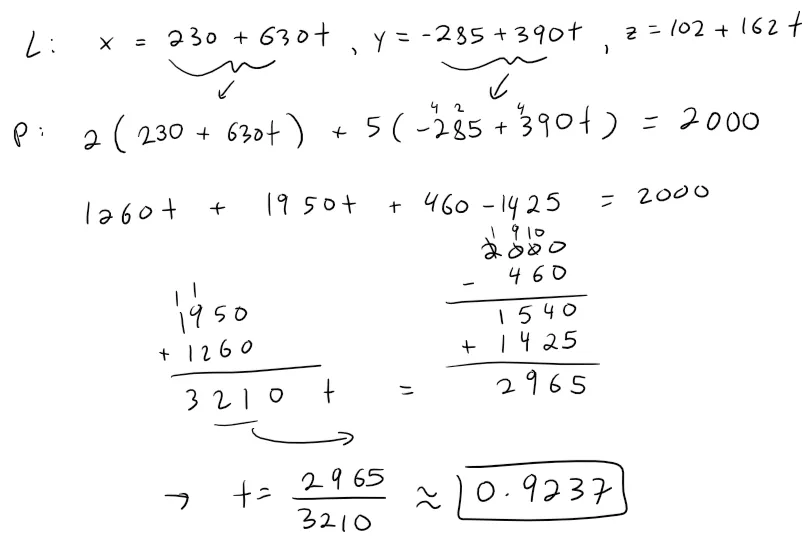
Calculation Check:
https://www.wolframalpha.com/input?i=solve+for+t%3A+2%28230%2B630t%29+%2B5%28-285%2B390t%29%3D2000
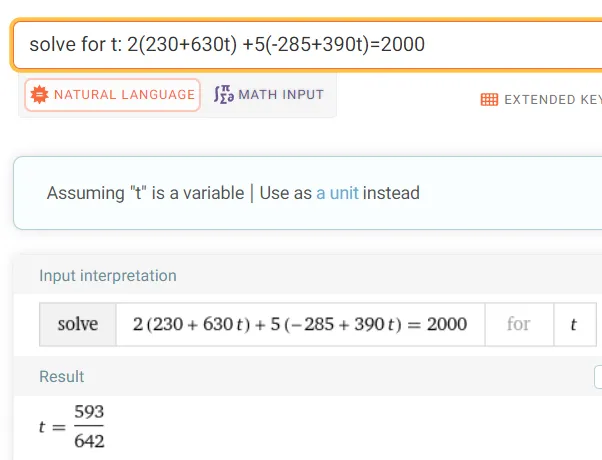
2965/5 = 593
3210/5 = 6422965/3210 = 0.9237
593/642 = 0.9237
Thus plugging our value of the parameter t into the line L, we obtain the point where it needs to be clipped on the right clipping plane:
x = 230 + 630 * 593/642 = 811.9159
y = -285 + 390 * 593/642 = 75.2336
z = 102 + 162 * 593/642 = 251.6355
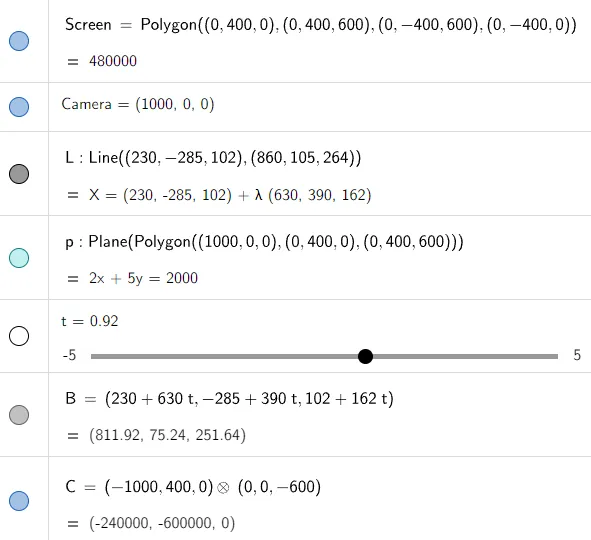
Plotting all this out in the GeoGebra 3D graphing calculator we can see where the line gets clipped! #Amazing
Equation of the Top Clipping Plane
Let's follow the same procedure to find the top clipping plane, and where the line intersects.
Calculation Check:
https://www.wolframalpha.com/input?i=solve+for+t%3A+3%28230%2B630t%29+%2B5%28102%2B162t%29%3D3000
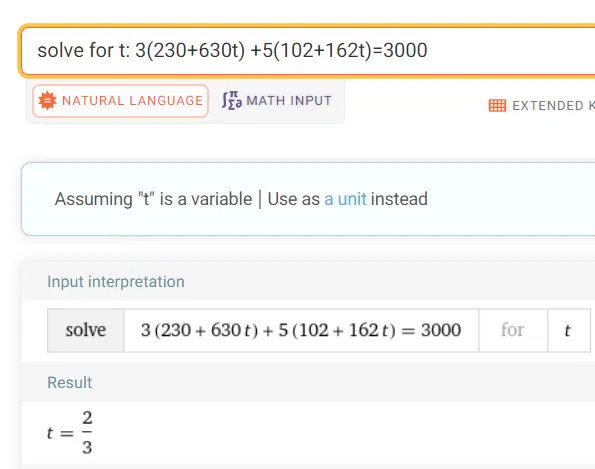
Plugging in our value of t into the line we get:
x = 230 + 630 * 2/3 = 650
y = -285 + 390 * 2/3 = -25
z = 102 + 162 * 2/3 = 210
Graphing this out we get:
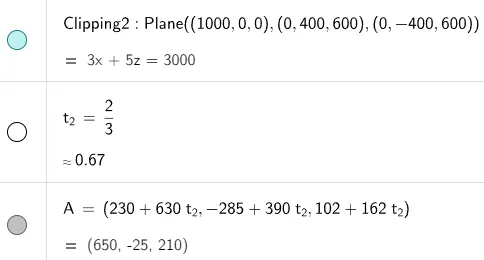
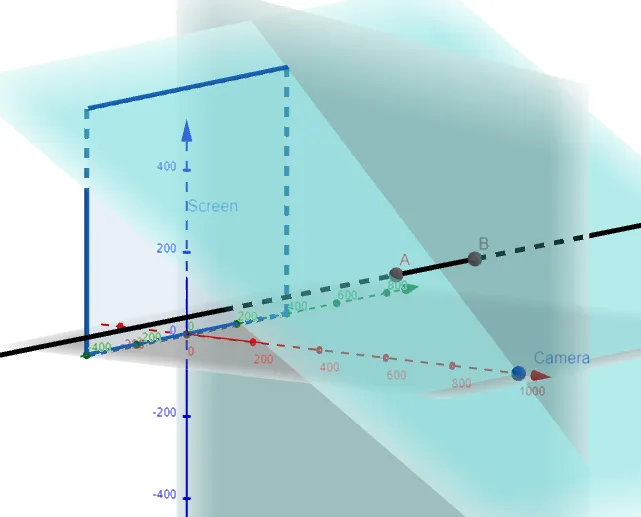
Note that clipping at the top plane (A) means we don't need to clip again at the right clipping plane (B).
Equation of the Left Clipping Plane
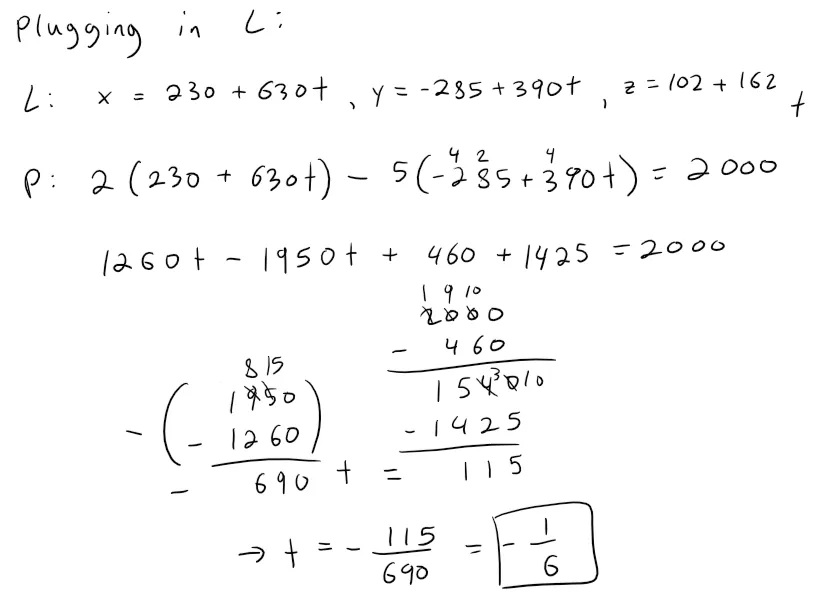
By symmetry, the left clipping plane is the same as the right clipping plane but every y is replaced by -y.
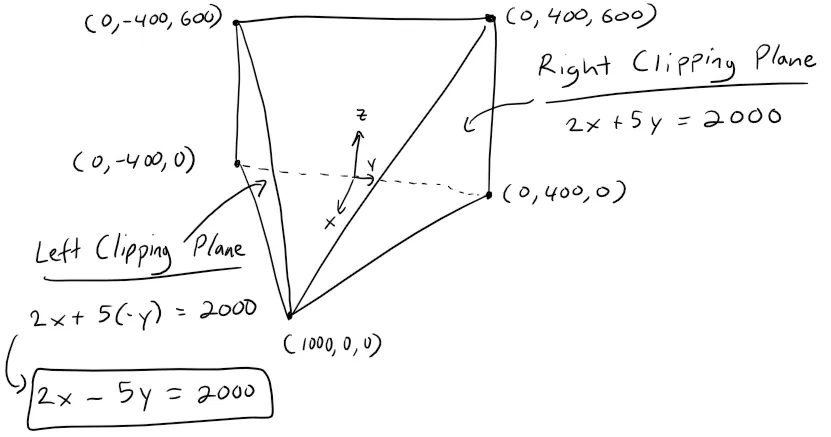
Calculation Check:
https://www.wolframalpha.com/input?i=solve+for+t%3A+2%28230%2B630t%29+-5%28-285%2B390t%29%3D2000
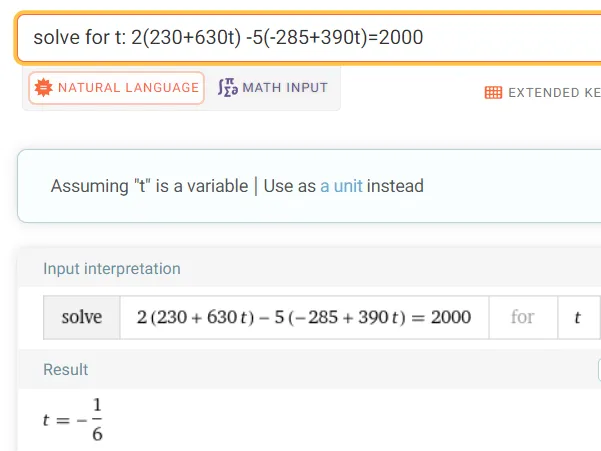
1/6 = 0.1667
115/690 = 0.1667115/5 = 23
690/5 = 138
138 / 23 = 6(523)/(523*6) = 0.1667
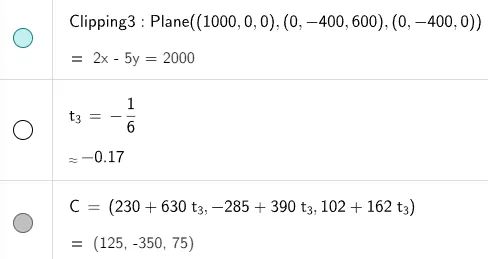
Plugging in our value of t into the parametric equations of the line we get:
x = 230 + 630 * (-1/6) = 125
y = -285 + 390 * (-1/6) = -350
z = 102 + 162 * (-1/6) = 75
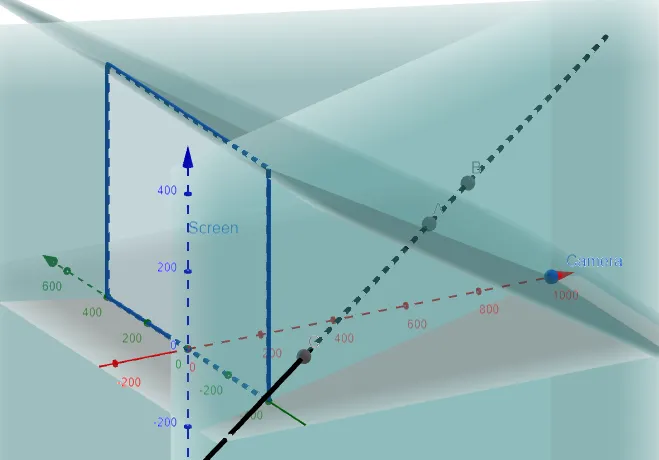
Graphing this out we get:
Equation of the Bottom Clipping Plane
The bottom clipping plane is just the xy-plane, which is just the set of all values where z = 0; hence that is our clipping plane.
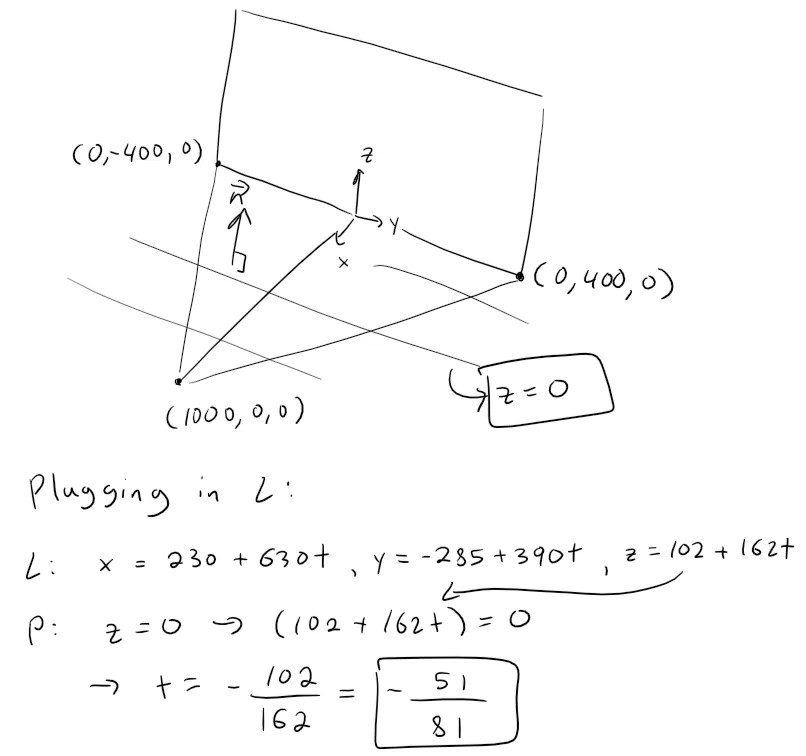
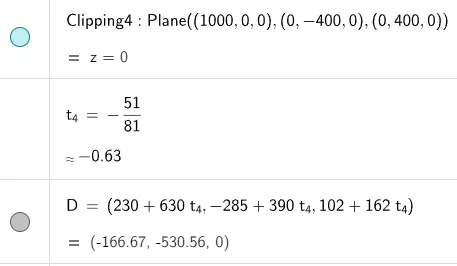
Plugging in our value of t into the line we get:
x = 230 + 630 * (-51/81) = -166.6667
y = -285 + 390 * (-51/81) = -530.5556
z = 102 + 162 * (-51/81) = 0
Graphing this out we get:
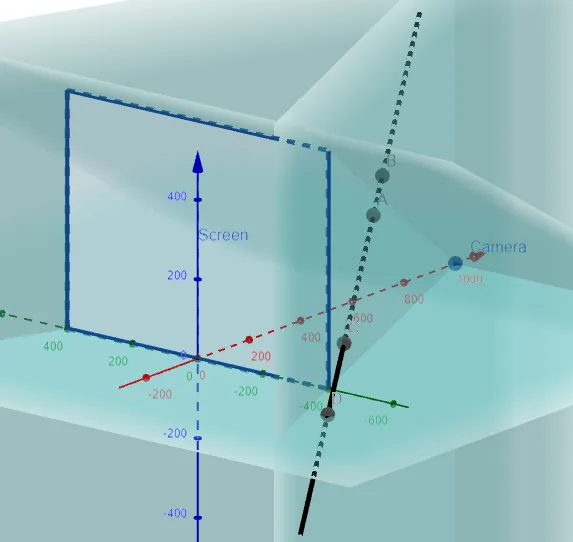
Summary
The line passes through only two clipping planes, the top one (at point A) and the left side (at point C):
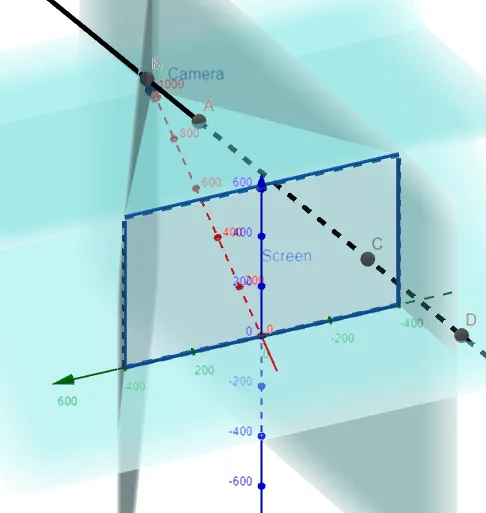
Thus the line gets clipped at the points:
On the Top Clipping Plane at the point (650, -25, 210).
On the Left Clipping Plane at the point (125, -350, 75).
Question 2
If the clipped line segment is projected on the screen window, identify the resulting line segment.
Solution:
We need to project the clipped points (650, -25, 210) and (125, -350, 75) onto the screen and determine the resulting endpoints on the screen.
Projecting 3D on to 2D
First let's consider how the x, y, and z-coordinates get projected from 3D on to the 2D screen.
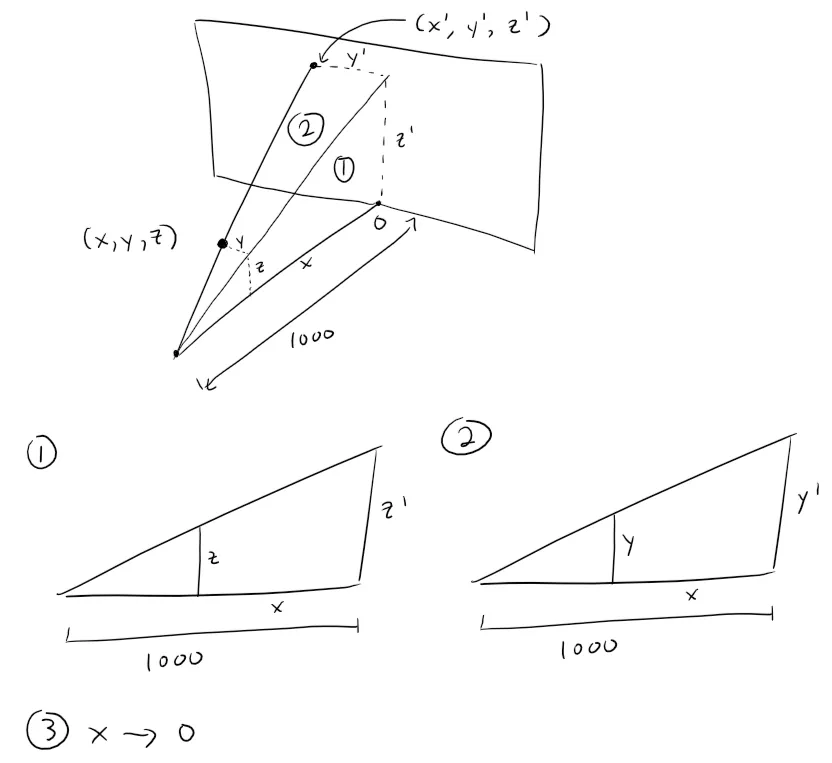
We can now determine a formula for the projection of both the y and z coordinates using similar triangles, while the x coordinate just becomes equal to zero.
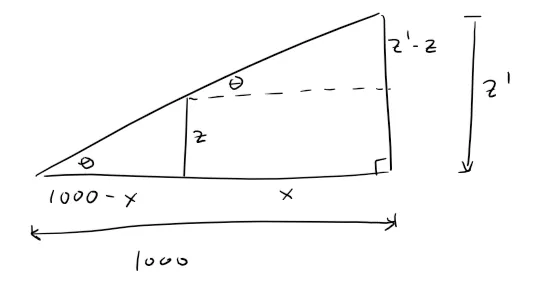
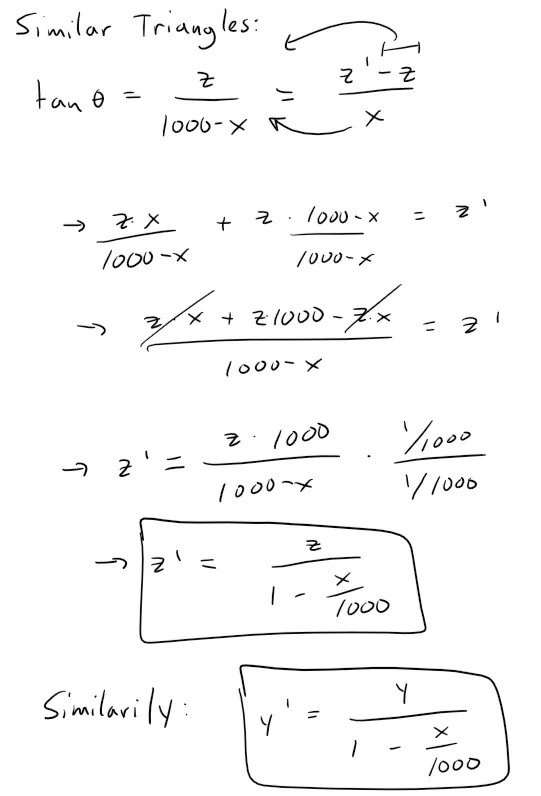
This means that our clipped points from Question 1 become projected to new points using the above formulas:
Clipping point (650, -25, 210) becomes:
(0, -25/(1-650/1000) = -71.4286, 210/(1-650/1000) = 600)
= (0, -71.43, 600)
Clipping point (125, -350, 75) becomes:
(0, -350/(1-125/1000) = -400, 75/(1-125/1000) = 85.7143)
= (0, -400, 85.71)
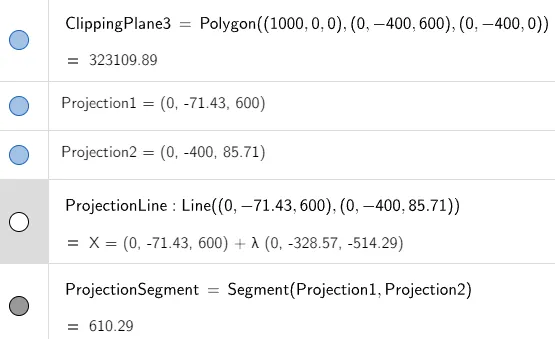
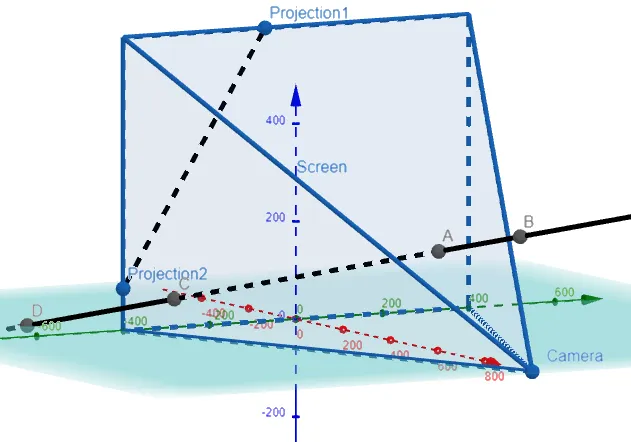
Thus the resulting line segment can be determined using the vector equation of a line:
r = r0 + tv
= <0, -71.43, 600> + t<0 - 0 = 0, -400-(-71.43) = -328.57, 85.71-600 = -514.29 >
= <0, -71.43, 600> + t<0, -328.57, -514.29> for 0 ≤ t ≤ 1.
We can graph all this out in GeoGebra.
Question 3
Use parametric equations to plot the edges of the screen window, the clipped line segment, and its projection on the screen window.
Then add sight lines connecting the viewpoint to each end of the clipped segments to verify that the projection is correct.
Solution:
I'm going to skep the first part because GeoGebra has already built in line segments without needing to put in parametric equations.
Thus we can simply add lines connecting the camera and the projection, and if they connect the clipped points, then the projection is correct! That is, we get a straight line connecting the camera, the clipped points, and the projection on the screen.
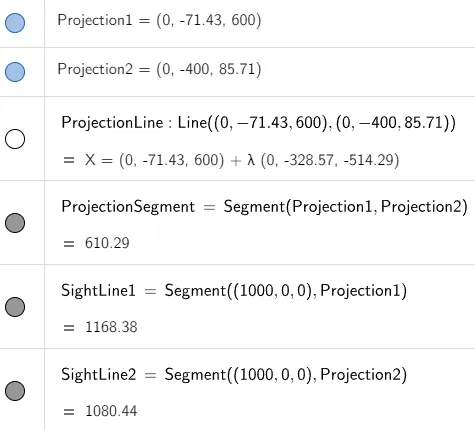
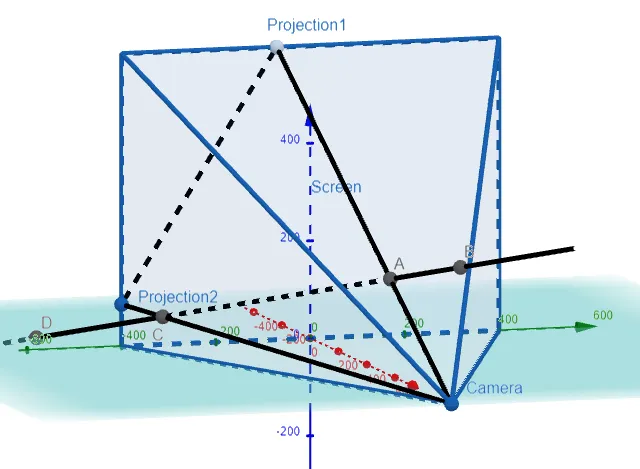
Note the lines connects directly through the clipped lines, thus proving our projection is correct! Amazing stuff!
Question 4
A rectangle with vertices (621, -147, 206), (563, 31, 242), (657, -111, 86), and (599, 67, 122) is added to the scene.
The line L intersects this rectangle.
To make the rectangle appear opaque [not transparent], a programmer can use hidden line rendering, which removes portions of objects that are behind other objects.
Identify the portion of L that should be removed.
Solution:
Let's graph out the rectangle inside GeoGebra as well as its projection onto the screen.
(621, -147, 206) projects to:
(0, -147/(1-621/1000) = -387.8628, 206/(1-621/1000) = 543.5356)
= (0, -387.86, 543.54)
(563, 31, 242) projects to:
(0, 31/(1-563/1000) = 70.9382, 242/(1-563/1000) = 553.7757)
= (0, 70.94, 553.78)
(657, -111, 86) projects to:
(0, -111/(1-657/1000) = -323.6152, 86/(1-657/1000) = 250.7289)
= (0, -323.62, 250.73)
(599, 67, 122) projects to:
(0, 67/(1-599/1000) = 167.0823, 122/(1-599/1000) = 304.2394)
= (0, 167.08, 304.24)
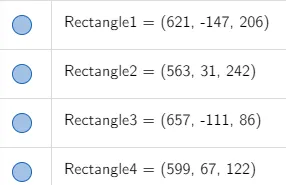
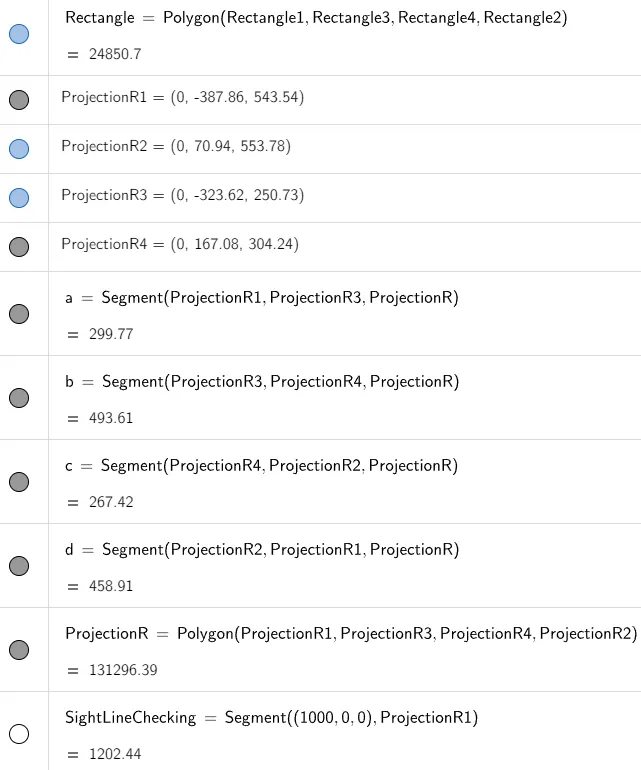
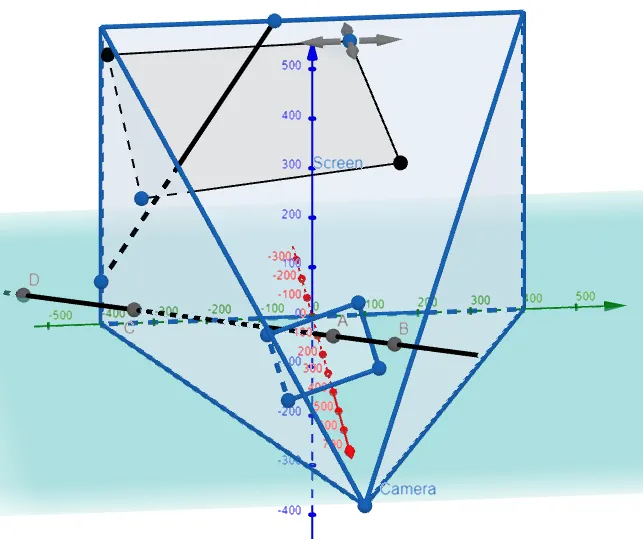
We are asked to remove the portion of the line behind the rectangle that is projected onto the screen.
To do this, we need to determine two points:
- The point at which the line intersects the rectangle.
- The point at which the projected line intersects the bottom boundary of the projected rectangle.
Point of Intersection of the Line and Rectangle
To determine the point of intersection of the line and rectangle, we first determine the equation of the plane that contains the rectangle.
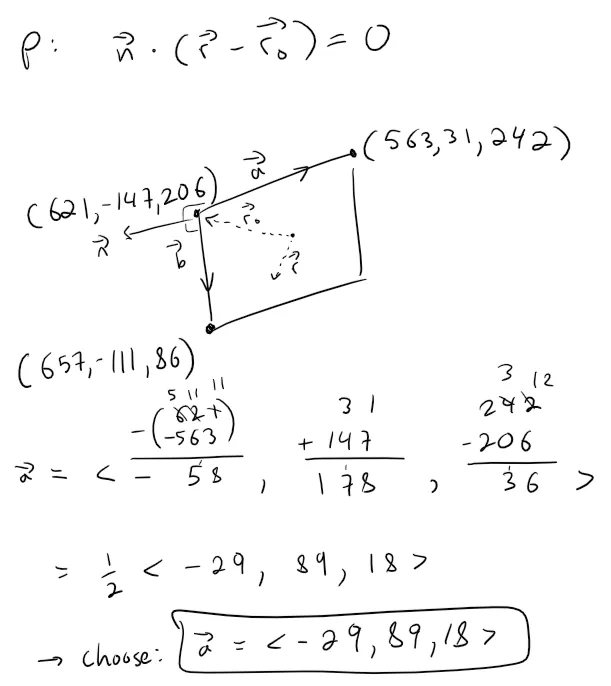
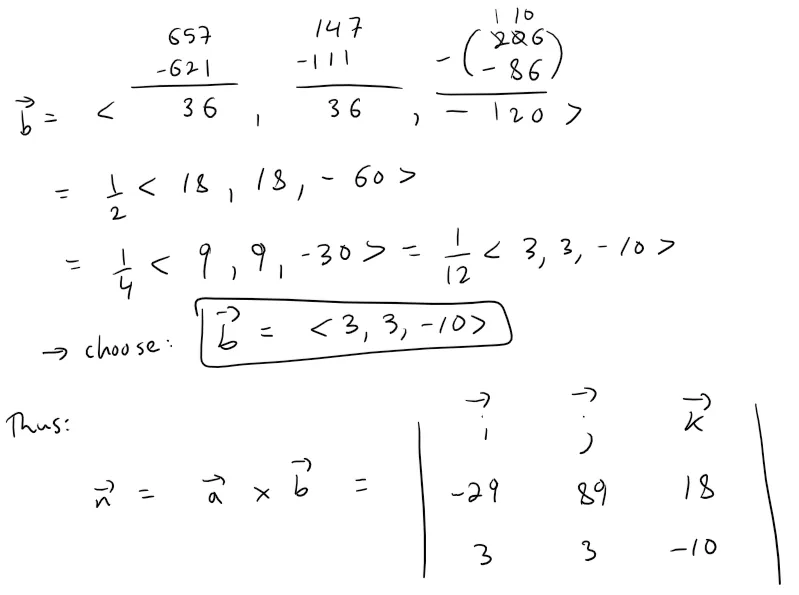
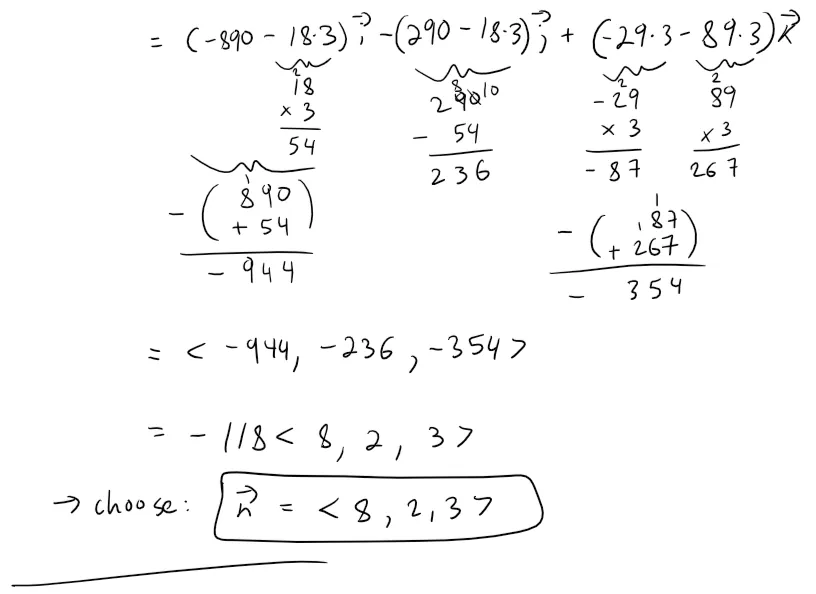
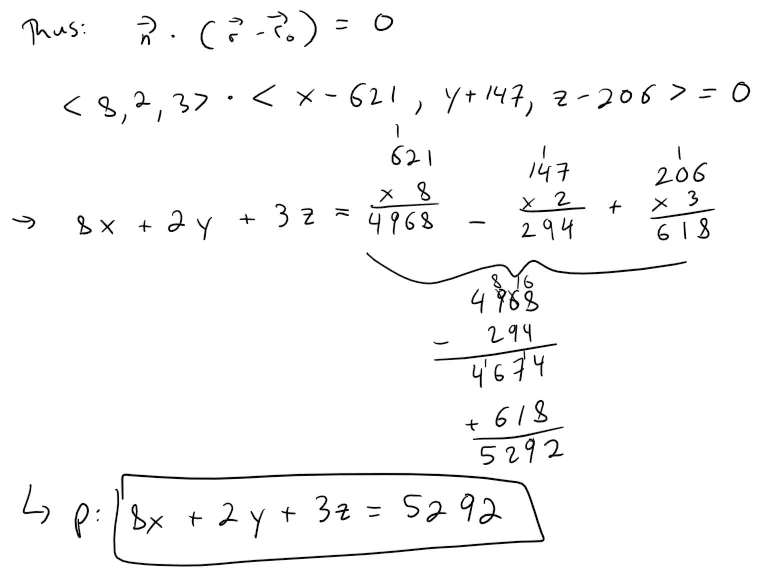
Calculation check:
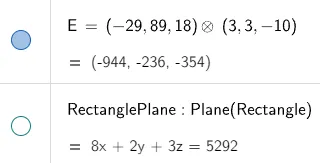
944 / 118 = 8
236 / 118 = 2
354 / 118 = 3621 * 8 - 147 * 2 + 206 * 3 = 5,292
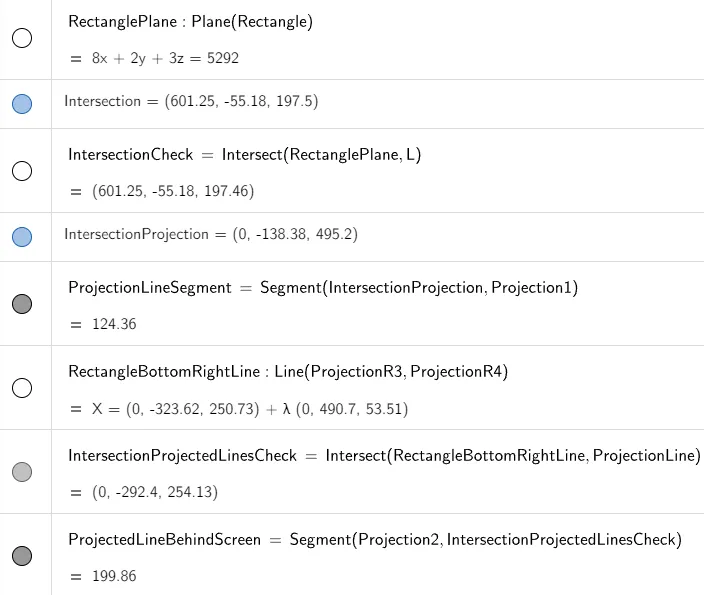
Now we can plug in our parametric equations of the line into the equation of the plane for the rectangle to get the point where they intersect.
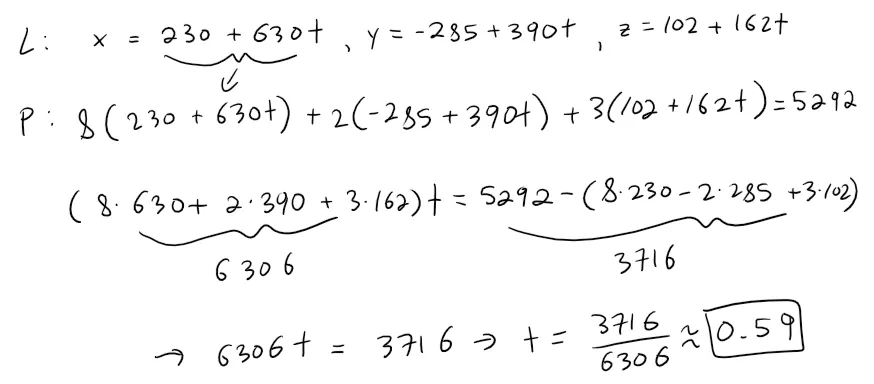
Calculation check:
8 * 630 + 2 * 390 + 3 * 162 = 6,306
5292 - (8230 - 2285 + 3*102) = 3716
3716/6306 = 0.5893
3716/2 = 1858
6306/2 = 31531858/3153 = 0.5893
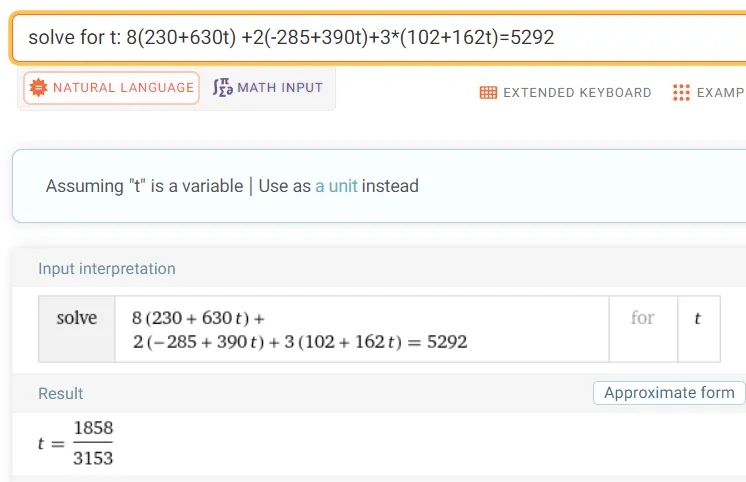
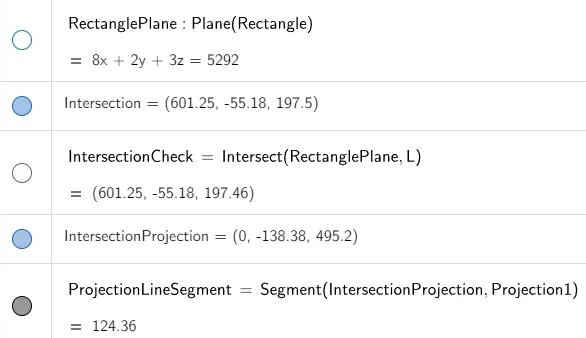
Plugging in the value of t inside the parametric equations of the line we get:
x = 230 + 630 * 1858/3153 = 601.2464
y = -285 + 390 * 1858/3153 = -55.1808
z = 102 + 162 * 1858/3153 = 197.4634
And this point projects onto the screen at:
x' = 0
y' = -55.1808 / (1 - 601.2464/1000) = -138.3832
z' = 197.4634 / (1 - 601.2464/1000) = 495.2015
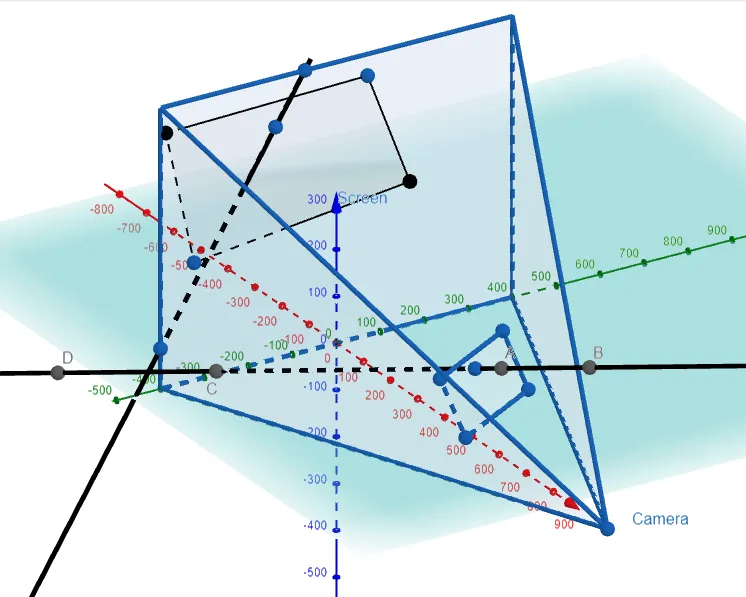
Graphing this out in GeoGebra, we have:
Point of Intersection of the Projected Line and Projected Rectangle
From the above image, the projected line intersects the bottom right portion of the projected rectangle.
Recall the vector equation of the projected line we calculated earlier:
r = <0, -71.43, 600> + t<0, -328.57, -514.29>
And recall the coordinates of the projected rectangle.
R1 = (0, -387.86, 543.54)
R2 = (0, 70.94, 553.78)
R3 = (0, -323.62, 250.73)
R4 = (0, 167.08, 304.24)
Let's calculate the vector equation of the bottom right portion of the projected rectangle.
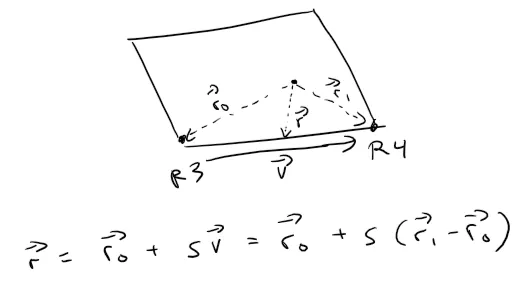
Actually, let's type this out to save time:
r = <0, -323.62, 250.73> + s<0-0, 167.08-(-323.62), 304.24-250.73>
= <0, -323.62, 250.73> + s<0, 490.7, 53.51>
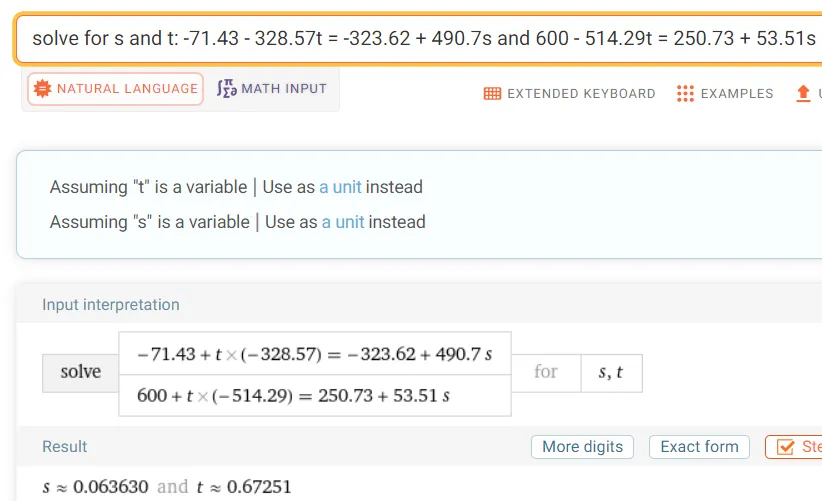
If the lines intersect then we should be able to obtain values of the parameters t and s such that the coordinates equal for each line:
x = 0
y = -71.43 - 328.57t = -323.62 + 490.7s
--> (-71.43 + 323.62) - 328.57t = 490.7s
--> (252.19/490.7) - (328.57/490.7)t = s
--> 0.5139 - 0.6696t = s --> Equation 1
z = 600 - 514.29t = 250.73 + 53.51s
--> (600 - 250.73) - 514.29t = 53.51s
--> (349.27/53.51) - (514.29/53.51)t = s
--> 6.5272 - 9.6111t = s --> Equation 2
Subtracting the Equation 2 from Equation 1, we can thus solve for t:
(0.5139 - 6.5272) + (-0.6696 + 9.6111)t = 0
--> -6.0133 + 8.9415t = 0
--> t = 6.0133/8.9415 = 0.6725
Plugging this value of t into either Equation 1 or 2 and solving for s we get:
s = 0.5139 - 0.6696*0.6725 = 0.0636
Plugging these values into the two equations of the projected lines we get:
Projected line:
x = 0
y = -71.43 - 328.570.6725 = -292.3933
z = 600 - 514.290.6725 = 254.14Projected bottom right line of rectangle:
x' = 0
y' = -323.62 + 490.70.0636 = -292.4115
z' = 250.73 + 53.510.0636 = 254.1332
Calculation check:
Graphing it All Out in GeoGebra 3D Graphing Calculator
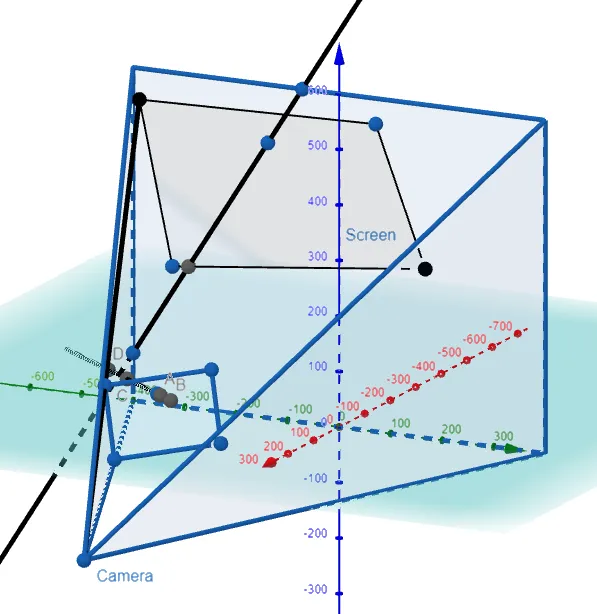
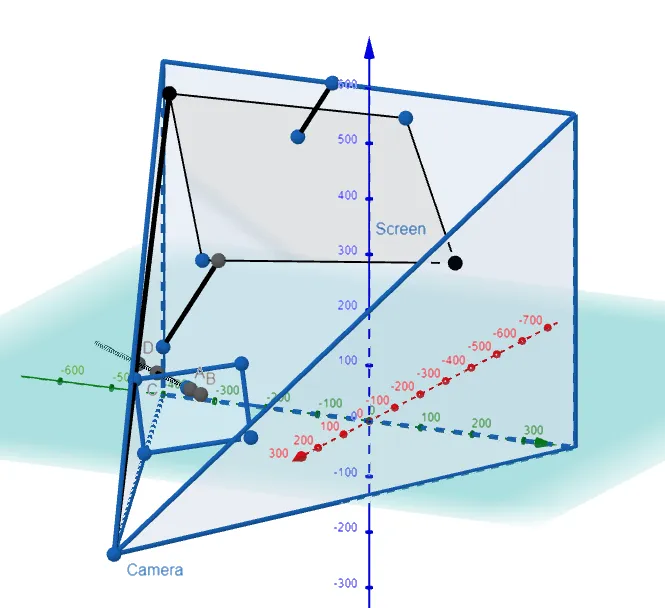
Graphing this out in GeoGebra, and hiding the line segment projected behind the screen, we have our final projected image:
Absolutely amazing stuff!!