Last week, I didn't get to submit an X analytics report due to some travel and Thanksgiving celebrations. Therefore, I'll dig a little deeper this week and report on the last 28 days.
First, a summary of impressions for November 2023:

As you can see, my impressions for the month of November (so far) are only at 9,669. Compare that to October when I had 41.6 thousand impressions, most of that in only half a month. I guess X users were kind to me in my first month as an X Blue subscriber. Still, I'm not disappointed.
Before joining X Blue, my tweet impressions were in the 2,400 range. 9,669 is certainly a big improvement over that.
I predict my impressions will jump over 10,000 before the end of the month. While down from October, this represents an upward trend in tweet impressions. I am not disappointed at all.
28-Day Tweet Activity on X
X's default tweet activity report is for 28 days. Since today is November 27th, that includes the last day of October. My 28-day tweet impressions comes to 10.6 thousand. For the month of November, that number is 10.2 thousand.

That equates to 370 tweet impressions per day, on average. However, if you subtract my tweet impressions count for November, that means that my tweet impression count for the last day of October was 931. Not bad.
Looking at engagements over the past 28 days, engagement rate was 7.9 percent. Link clicks registered at 49, an average of 2 per day, and retweets without comments were 16.

Likes and replies were 379 and 164, respectively. These are both in the neighborhood of the daily average compared to the last report.
My top tweet over the last 28 days saw 347 impressions and 22 engagements.

My highest engagement percentage was 21.1 percent, for a tweet I posted on November 22.

All in all, these are not bad numbers, but let's drill down to the last 7 days.
7-Day Tweet Activity on X
Until November 23, I was accustomed to posting on X several times a day. Because I spent the week with a daughter and her family beginning November 23 through yesterday, my tweet activity was minimal over the Thanksgiving holiday. Still, the numbers weren't that bad.
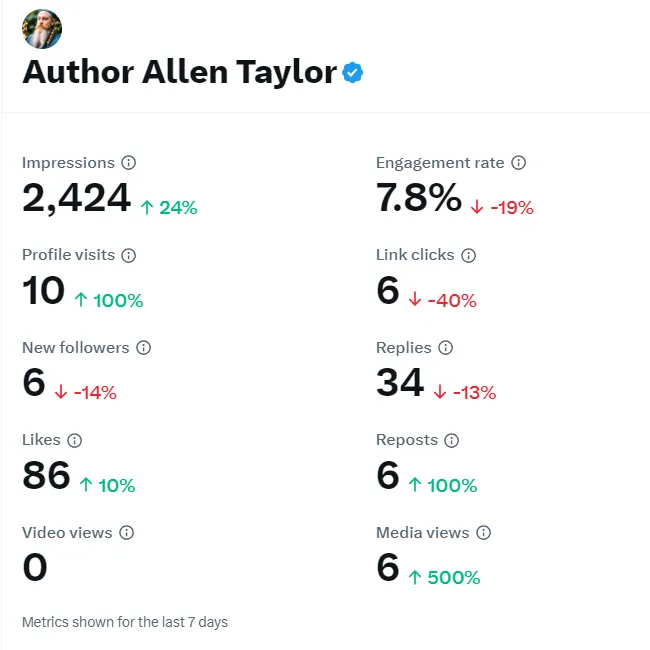
Over the last 7-day period, my tweet impressions were 2.3 thousand, or an average of 317 per day. That equates to a slight dip.

My tweet engagement percentage over the past 7 days was 7.8 percent, only slightly less than the 28-day engagement rate. Link clicks were 6, or 1 per day on average. Retweets without comments were also 6, or 1 per day on average.
Likes and replies in the last 7 days were 75 and 31, respectively. That equates to 11 and 4, respectively. Again, that's in the neighborhood of my last report and, in terms of daily average, is closer even than the 28-day average for both metrics.

Finally, the top tweet for impressions and engagements was the same one as for the 28-day period, posted on November 22. Just as well, the tweet with the highest engagement rate was the same as for the 28-day period, however, the engagement rate was slightly less over the 7-day period: 19.0 percent.

That concludes my X Blue analytics report for this week. Metrics that have dipped in the last 7 days include engagement rate, link clicks, replies, and new followers. Speaking of new followers, I did manage to pick up 6 new followers in the last 7 days, however I picked up 14 in the last 14 days. My current follower count is 277.
Metrics that have gone up in the last 7 days include impressions, profile visits, likes, reposts, and media views.
If you have not followed me on X, I encourage you to do so now. You'll see content you won't find anywhere else.