Hi Everyone,
In this post, I want to reflect on cryptocurrency prices in 2021. I am focusing mostly on Bitcoin and Hive. This is because Bitcoin strongly influences all cryptocurrency markets and because I am most committed to Hive (financially and emotionally). 2021 is considered as the Bull Year in the approximately four-year cycle created by the Bitcoin halving event. However, there is no rule stating that 2021 had to be bullish or that the Bull Run/Cycle only occurs for one year every four years. Bitcoin performed well in both 2019 and 2020. Many other coins did not. Ironically, 2021 could be more relevant to holders of other coins even though the four-year cycle revolves around Bitcoin.
For many of us invested in cryptocurrency, 2021 was an exciting year. Many cryptocurrencies soared to new highs. I have invested most heavily in Hive. I have accumulated Hive through lump sum investments in 2017, 2018, and 2020. I have also continued to accumulate Hive from posting content and curating (upvoting) posts. I sold off all my Steem and used some of that to buy Hive (I hold that Hive in my @captainhive account). I sold the rest of my Steem to do a bit of trading; I was not that adventurous and bought mostly Bitcoin.
I think some people may have been a little disappointed with the 2021 Bull Year. Bitcoin did not reach the prices that many cryptocurrency influencers claimed it would. The price of Bitcoin only went up by around 60% (price change from 1st January to 31st December). This is small compared to the 1300% increase in 2017. The price of Bitcoin performed significantly better in 2020. It increased by about 300% and increased by more in absolute terms ($21,000 vs. $17,000). The percentage price increase was also higher in 2019 (almost 100% increase). We could argue that 2021 did not standout as being particularly bullish for Bitcoin. However, Bitcoin does not represent the whole cryptocurrency world. Many of the other coins completely outpaced Bitcoin in terms of price gain in 2021. Tables in Figure 1 compare the price of the top 10 coins by market cap (January 2022), coins that fell out of the top 10 over the past year, Hive, and Steem.
Figure 1: Prices Increases of Various Coins in 2021
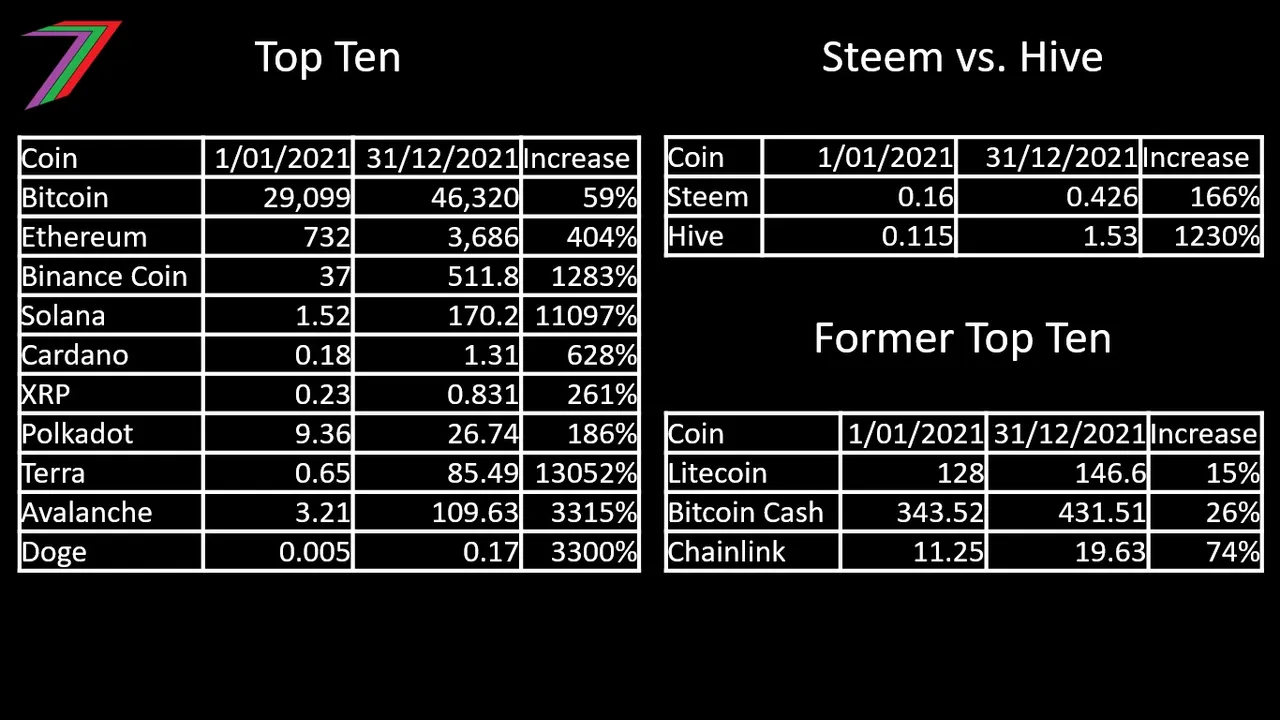
Source: CoinGecko
The prices of five of the top cryptocurrencies increased by over 1000% and two of these increased by over 10,000%. Hive had experienced price gains of over 1000%, which outperformed five of the top ten coins by market cap. Even the price of Steem increased by over 100%. The coins that fell out of the top ten did not perform as well but still had positive price gains.
Will the cryptocurrency bull run/cycle continue?

We have entered a new year but the cryptocurrency bull run/cycle may not be over yet. We have passed the point where I expected it to peak but it does not feel like it is over. The prices of cryptocurrencies climbed very quickly in the first third of 2021. Many of the top cryptocurrencies (7 out of 10) had higher prices in May than they did at the end of December. It looked like the market was getting too hot too fast and the price gains could not be sustained for long.
Instead of continuing to explode, there was a strong correction followed by a summer lull. Some people thought, we would have a quick bounce back and others thought the Bull Run was over. Neither was the case. In late July, cryptocurrency markets started to recover. Price continued climbing until the correction in September and then continued to increase into November. Bitcoin peaked at US69,000 on 10th November. Many other coins reached new all-time highs or peaked in November. Hive very briefly exceeded US$3. After these highs, the prices dropped lower to finish the year.
The increase in price in the second half of the year was not as strong or dramatic for many cryptocurrencies (Hive was an exception and far outperformed itself from the first half of the year). Many of the top cryptocurrencies barely exceeded their May highs or even fell short. Table 1 compares the prices of the top ten coins plus Hive.
Table 1: May and November Prices of Coins
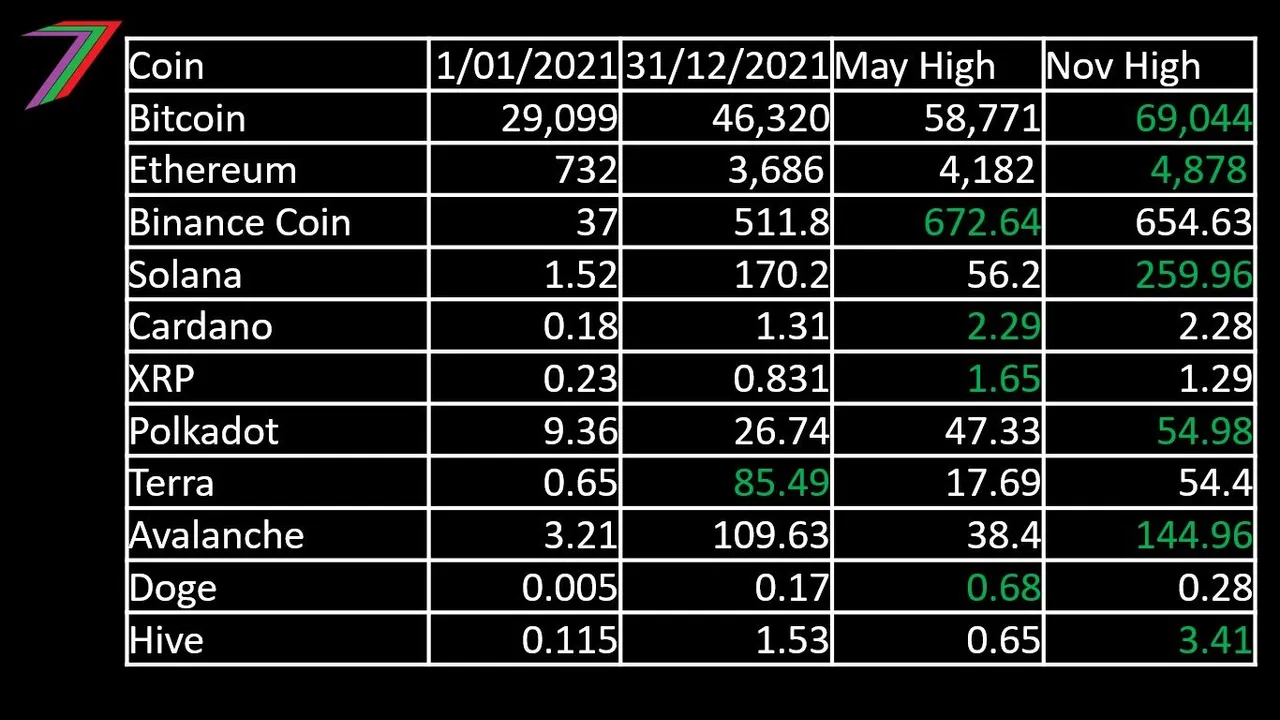
Source: CoinGecko
Market Cap
The growth in market cap value for cryptocurrency as a whole has been moderate compared to other bull cycles. This is particularly true for the second half of 2021. Figure 2 contains market cap trends since 2014 (log) and Figure 3 contains market cap trends for 2021.
Figure 2: Cryptocurrency Market Cap (2014 – 2021) (log trend)
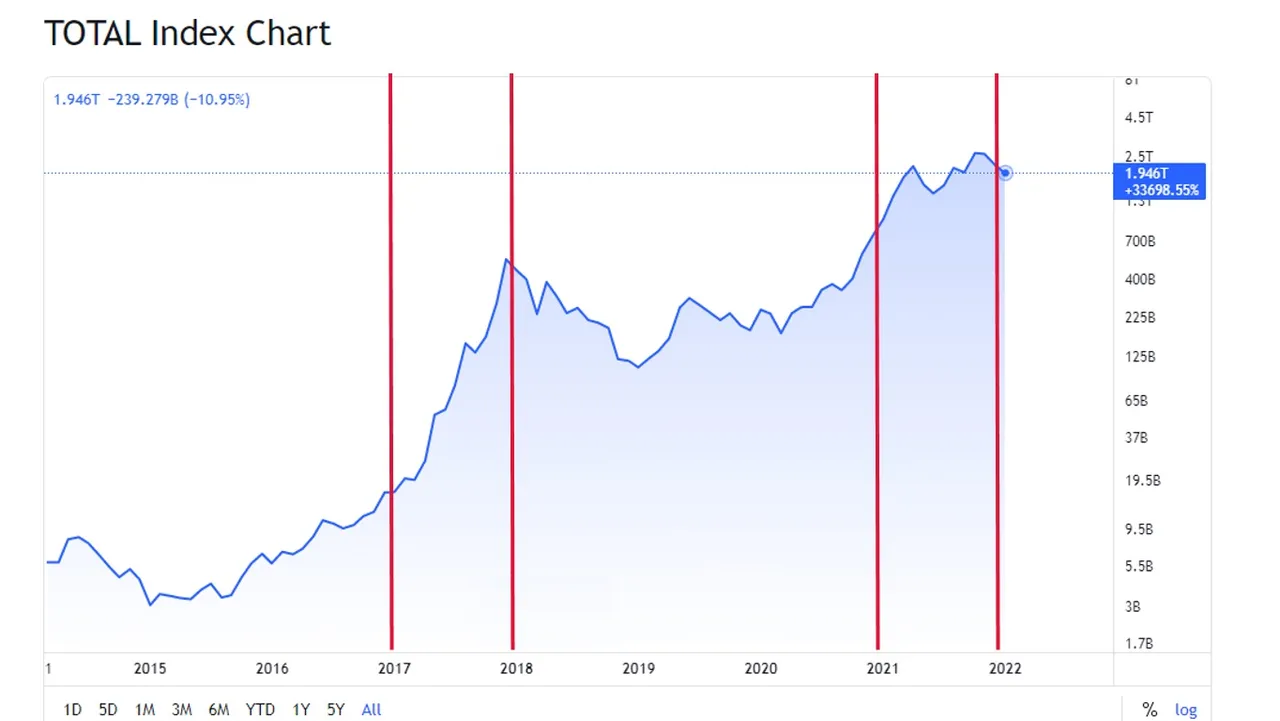
Figure 3: Cryptocurrency Market Cap (2021) (linear)
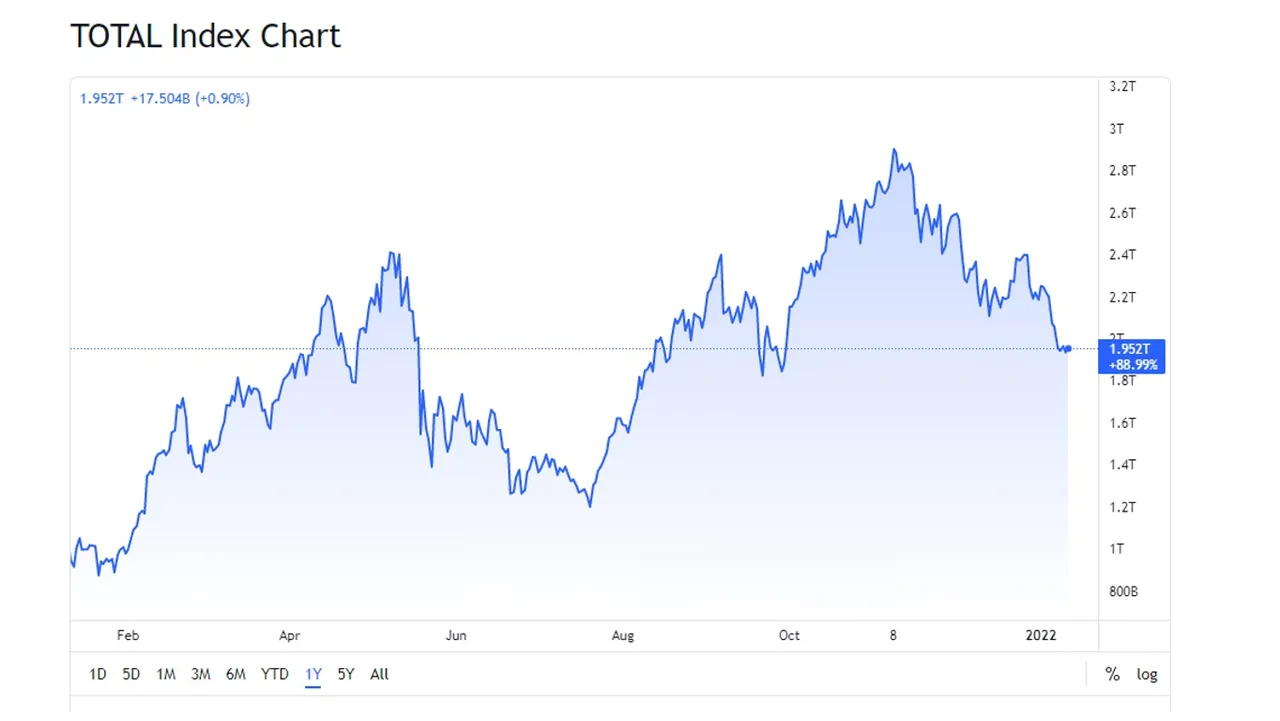
Source: Trading View
Currently, the market cap is only about 50% higher than it was at the end of the summer lull, about twice what it was at the beginning of 2021, and slightly lower than what it was during the May highs. We could argue that cryptocurrency, overall, did not have a bullish second half of the year.
Moving Average
If we turn our attention back to Bitcoin, we should consider moving averages such as the 20-week moving average. At the end of a Bull Run/Cycle, we would normally see the price of Bitcoin greatly exceed the moving averages. In the 2017 Bull Run, the price of Bitcoin reached 3 times the 20-week moving average before the market crashed. In the 2021 Bull Run, in February, the price of Bitcoin reached about 2 times the 20-week moving average before price levelled out for a few months and eventually falling in May. In the second half of the year, price barely reached 1 ½ times the 20-week moving average. Figures 4 and 5 contain the price of Bitcoin and the 20-week moving average.
Figure 4: Price of Bitcoin and 20-week Moving Average (5 Years)
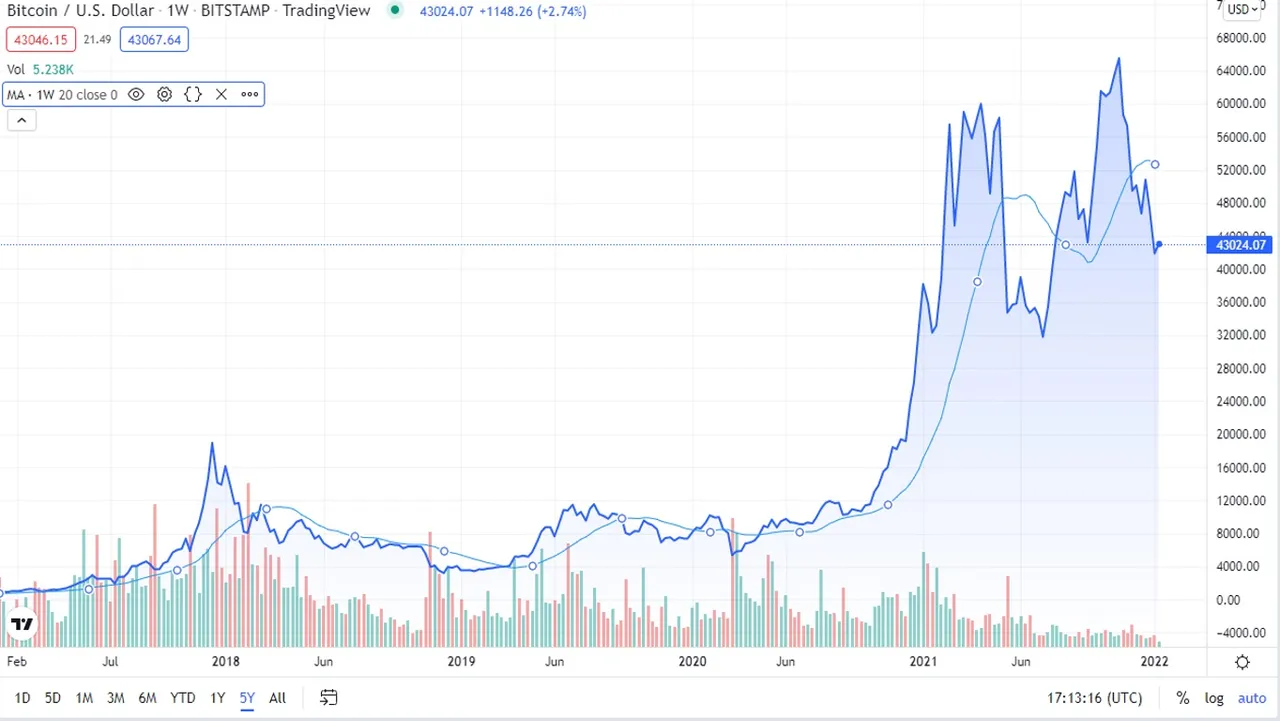
Figure 5: Price of Bitcoin and 20-week Moving Average (5 Years) (Log)
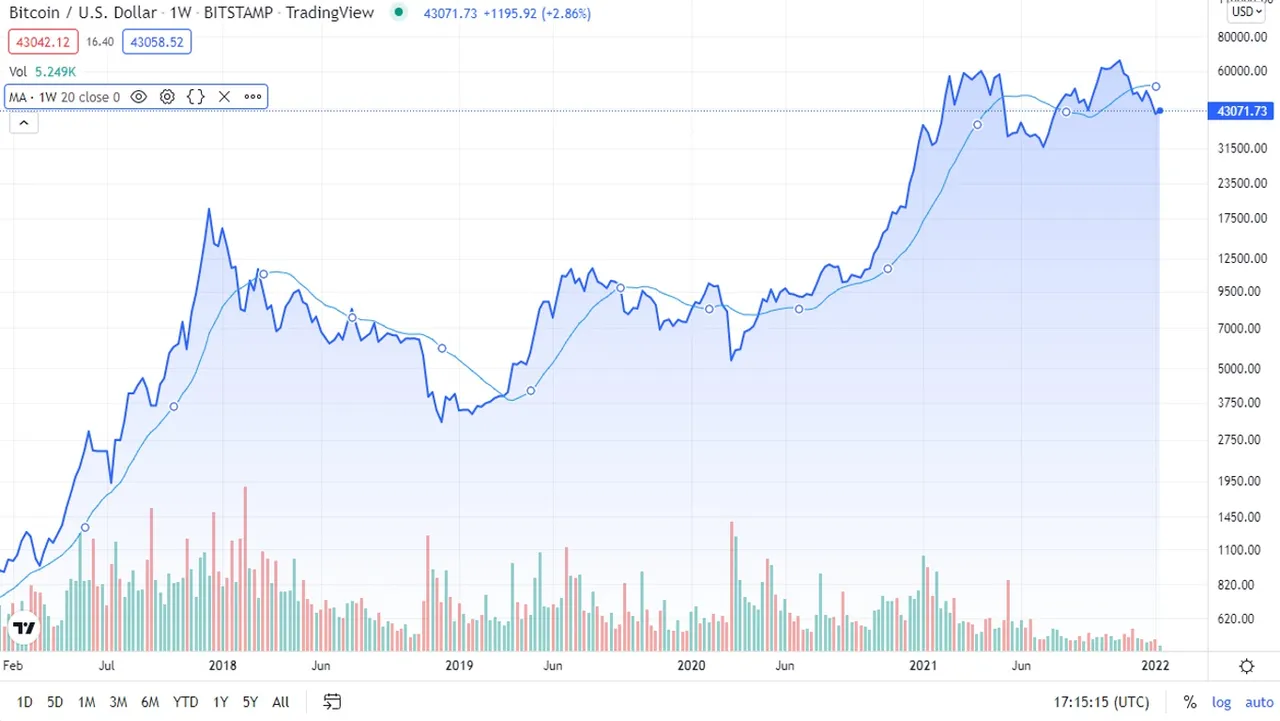
Source: Trading View
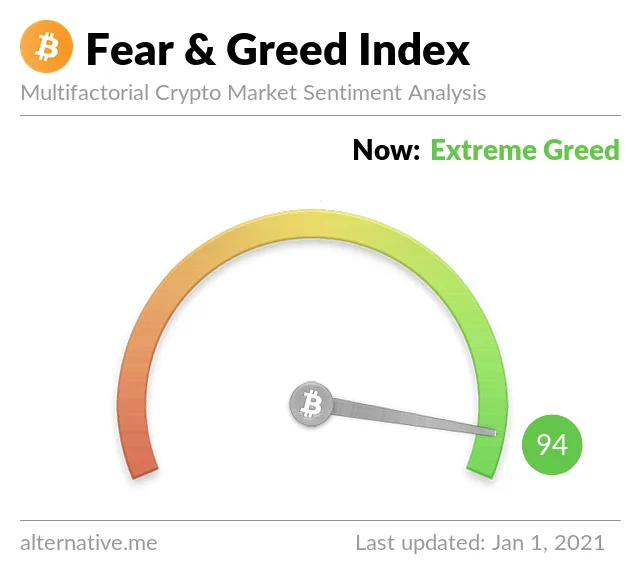
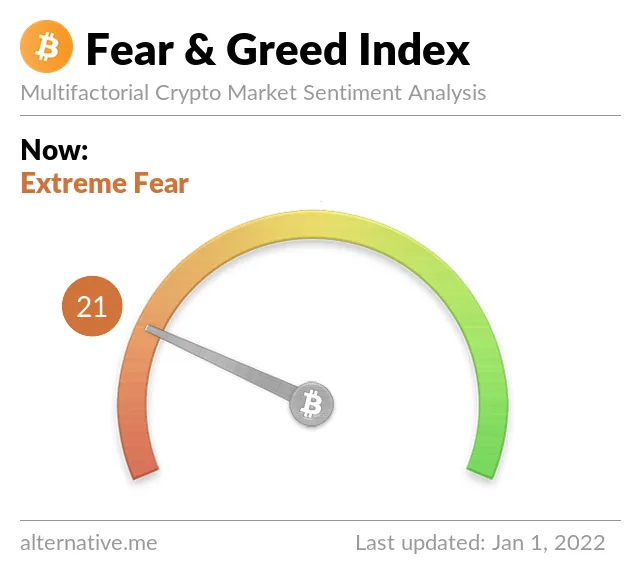
Fear and Greed Index
Another indicator to consider is the Fear and Greed Index. The index measures market sentiments towards cryptocurrencies (e.g. Bitcoin), stocks, assets, etc. A high score indicates ‘Greed’, which indicates the market could be overheating as people are becoming overly optimistic about further price increases; a price correction is considered more likely to occur. A low score indicates ‘Fear’, which indicates people are afraid of further price drops; a low score is often considered an opportunity to buy Bitcoin as it is likely to be undervalued.
In 2021, the Fear and Greed Index was very high in February (also the time when Bitcoin was the highest percentage above the 20-week moving average); it reached above 90 (highest in over 2 years) for about 2 weeks. When the price of Bitcoin stabilised, the score gradually decreased. In May, just prior to the major correction, the index was just above 70. During the summer lull, the index ranged between 10 and 30 for about 2 months. During the recovery, the index moved upwards but it did not reach the same levels as earlier in the year; it ranged between 70 and 80 for much of the increase. Figures 6 displays the Fear and Greed Index for 2021 and Figure 7 displays the Fear and Greed Index for the previous 4 years.
Figure 6: Bitcoin Fear and Greed Index 2021
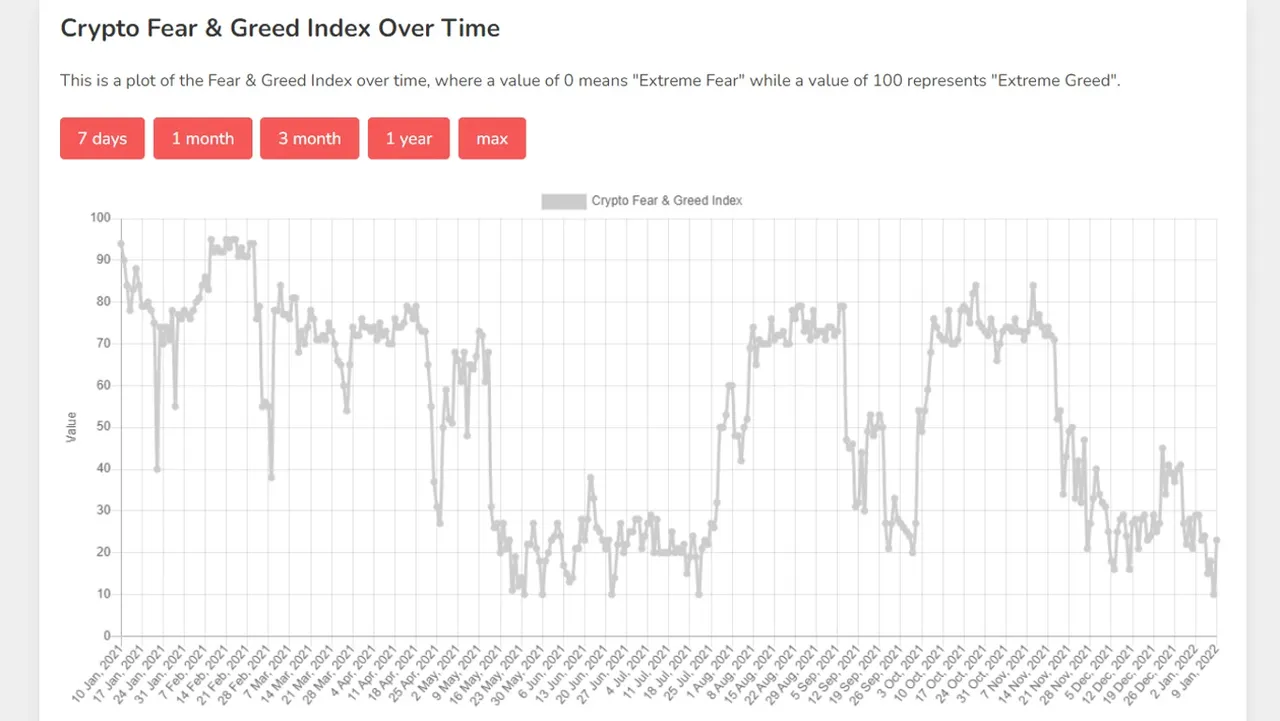
Figure 7: Bitcoin Fear and Greed Index 2018 to 2021
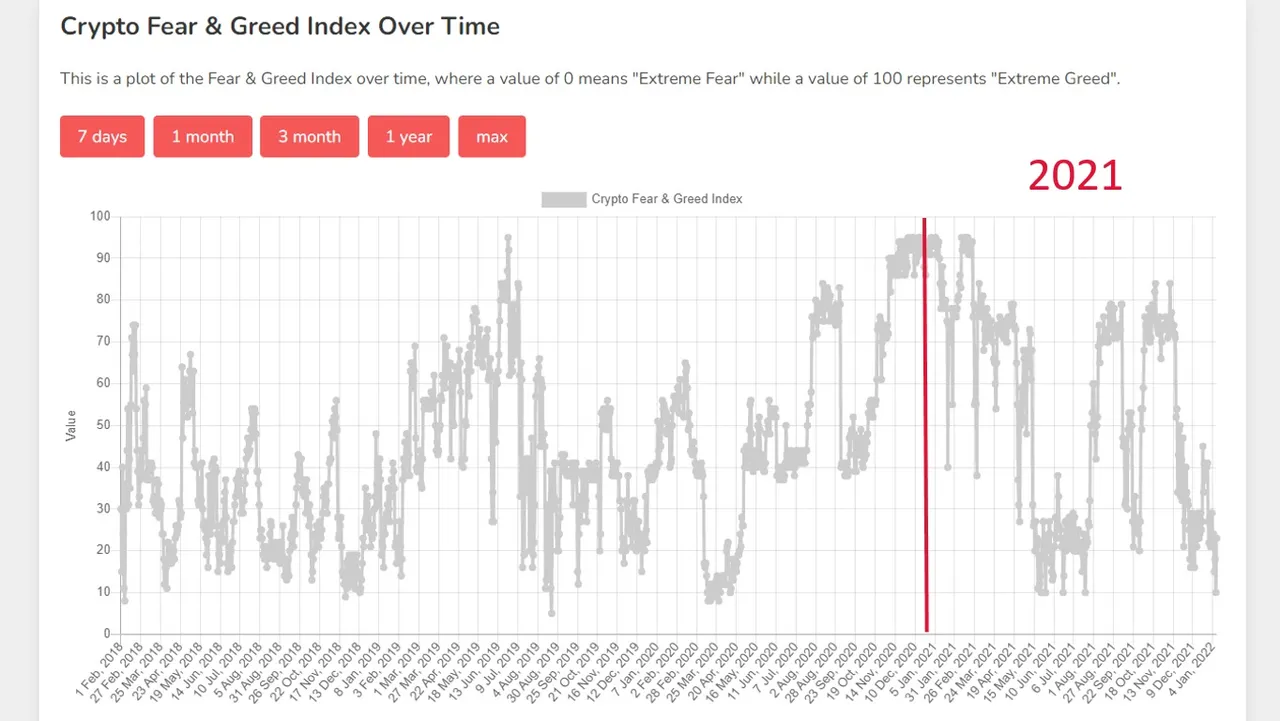
Source: Alternative
It may also be worth noting the extreme volatility of the Fear and Greed Index in 2021 for Bitcoin. It was either above 60 or below 30. It spent almost no time between 30 and 60.
Market Dominance
During the 2017 Bull Run, Bitcoin’s market dominance plunged from above 80% of total market cap (January 2017) to less than 40% (January 2018). Most of that dominance was lost in the first half of the year. This was mostly due to sharp increases in the market cap of coins such as Ethereum and XRP. In the second half of the year, Bitcoin regained significant market dominance (about 60%). Then it plunged at the end of 2017 and the very beginning of 2018. For the majority of 2018 and 2019, Bitcoin gradually regained some of its market dominance (between 60% and 70%). In 2020, it declined slightly and in 2021, it dropped significantly to below 50%. Figure 8 contains the market dominance of Bitcoin and several other cryptocurrencies from 2013 to end of 2021.
Figure 8: Bitcoin’s Market Dominance 2013 to 2021
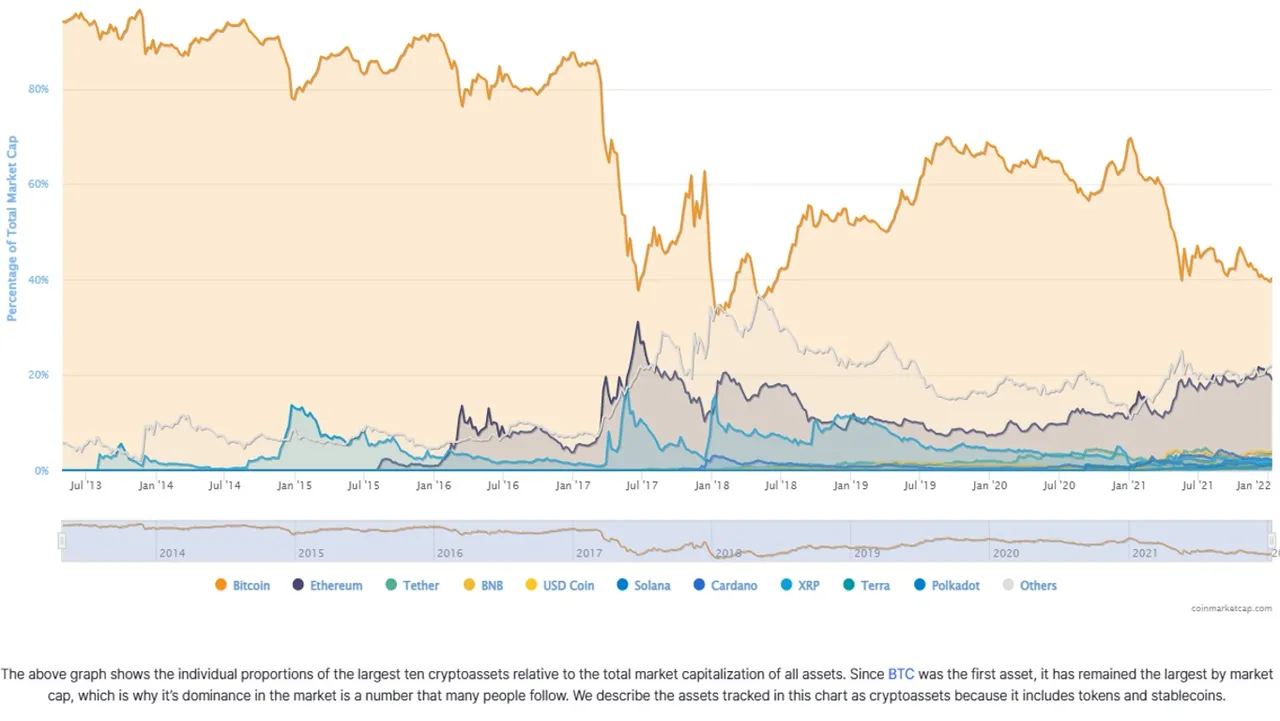
Source: Coin Desk
Bitcoin’s loss of dominance occurred in the second quarter of the year. This was when the price of Bitcoin was around the US$50,000 and US$60,000 range. During that period, many of the other cryptocurrencies were increasing significantly in price. In the second half of the year, Bitcoin regained some dominance but that declined slightly in the final two months of the year. Figure 9 contains the market dominance of Bitcoin and several other cryptocurrencies for 2021.
Figure 9: Bitcoin’s Market Dominance in 2021
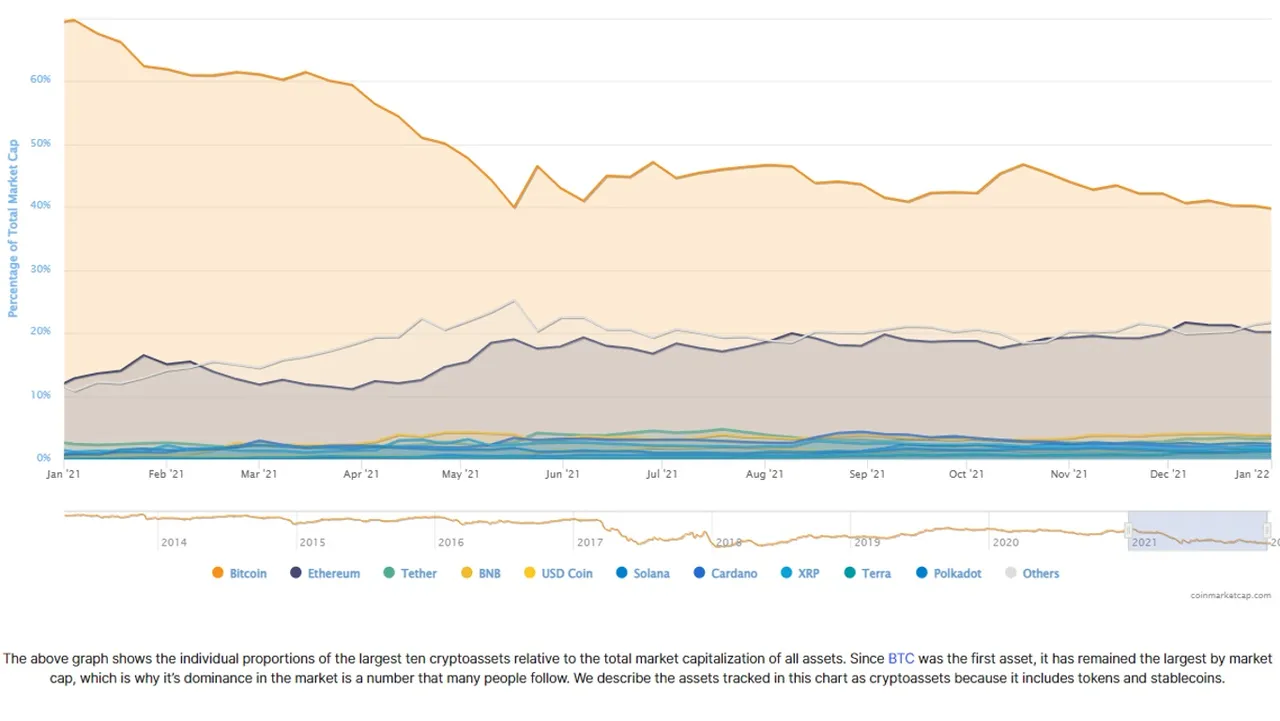
Source: Coin Desk
The second half of 2021 did not look like the continuation of the typical Bull Cycle (e.g. climbing upwards with the occasional correction) but it was also nothing like the typical end to a Bull Cycle (e.g. massive pump in price followed by a massive drop followed by a quick bounce followed by a prolonged downward trend). It looks like the cycle has been paused. If that were the case, an eventual continuation would be more likely than the end of the cycle. We currently do not have a bubble to burst. The cycle would have been more likely to end if prices had continued to increase during the summer.
My Final Thoughts
I would argue that 2021 was a good year for cryptocurrency. It was also a strange year for cryptocurrency. The market/s showed strong signs of overheating in the first half of the year. This could have ended the Bull Cycle. The massive pullback and ensuing lull, which was dreaded by many at the time, is proving to be a good thing (e.g. prevented the premature end to the Bull Cycle).
The crazy price explosion of meme coins such as Doge and Shiba Inu may have been exciting for many but I believe this was causing more harm than good to cryptocurrency as a whole. They drew attention away from projects that offer far more value to users as well as offered solutions to real world problems. The price increases in the meme coins came in very rapid pumps. For majority of the year, they did not increase. This indicates that the prices were manipulated upwards instead of through real world adoption.
I do not invest in many cryptocurrencies. I have invested mostly in Hive and I have done so for the long-run. 2021 was both a good year and, at times, a frustrating year for me as an investor in Hive. The initial climb was good and consistent. However, that did not last long. We soon had several quick pumps and dumps. Price could be up 50% in a couple of hours before falling back down over the next couple of days. In the middle of the year, the price dropped back down to about 20 cents and settled around 30+ cents for a couple of months.
In the second half of the year, the pumps and dumps returned but the dumps were not as big as the pumps. Therefore, price was consistently climbing. The price reached over US$3 and settled at above US$2. The recent correction has seen price fall below US$2 but it has held well above US$1. I think there is a good chance that the price will remain above $1 until we are deep into a Bear market. Figure 9 contains the price of Hive in US dollars and Bitcoin for 2021.
Figure 9: Price of Hive in 2021
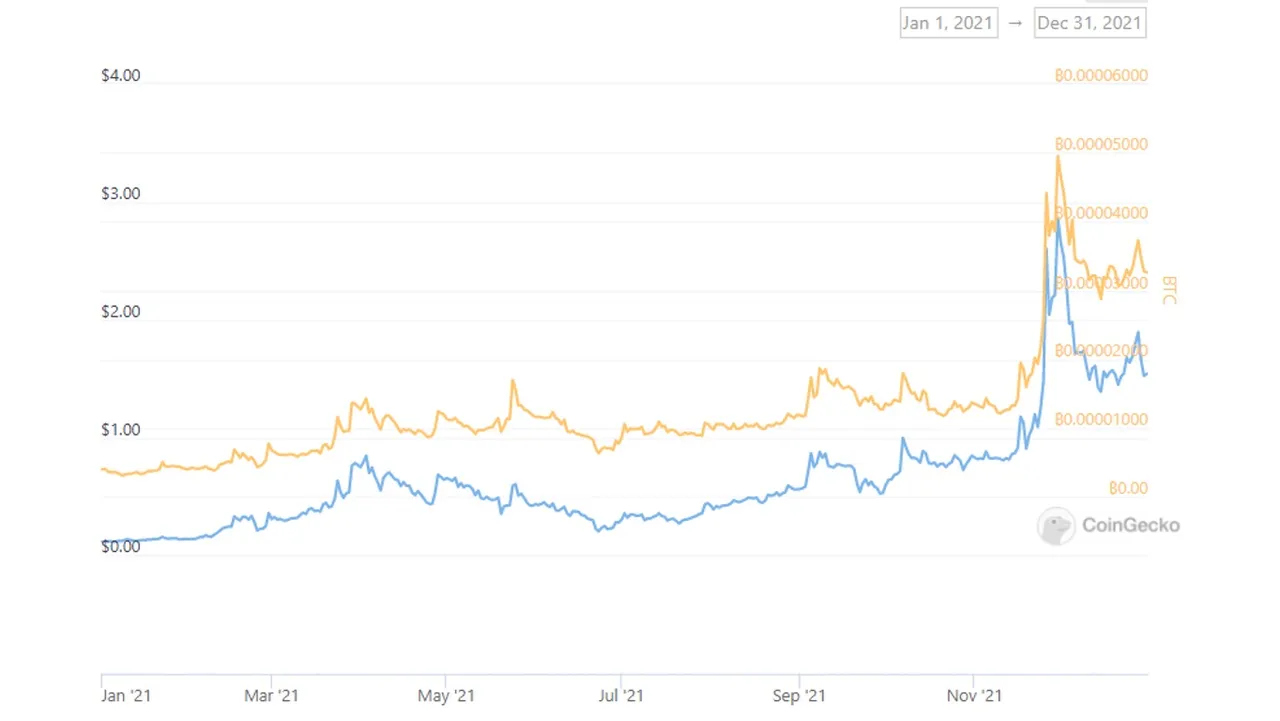
Source: CoinGecko
The cryptocurrencies markets are currently experiencing a dip. Many cryptocurrency influencers on social media are advising people to ‘buy the dip’. This strategy is not for everyone. If a person is new to cryptocurrency (e.g. making first investment), ‘buying the dip’ could be a good strategy if they are able and willing to wait for the price/s to rebound (they will eventually, if the right coins are bought). ‘Buying the dip’ is a good strategy for someone who just sold some of their coins. They could buy the same number of coins back and have money left over. However, if someone is already heavily invested and has not sold any of his or her coins ‘buying the dip’, could backfire. Nobody knows when the dip will end. Rather than risking more, it is probably better not to buy and just wait out the dip. These strategies will also vary depending on whether we are in a bull or a bear market.
If you are able to wait until the markets become bullish again, I believe buying during the Bear market when prices have stabilised to be a good move. The key to investing in cryptocurrencies is patience. Markets can take some time to recognise good value and potential.
More posts

If you want to read any of my other posts, you can click on the links below. These links will lead you to posts containing my collection of works. These 'Collection of Works' posts have been updated to contain links to the Hive versions of my posts.


My CBA Udemy Course
The course contains over 10 hours of video, over 60 downloadable resources, over 40 multiple-choice questions, 2 sample case studies, 1 practice CBA, life time access and a certificate on completion. The course is priced at the Tier 1 price of £20. I believe it is frequently available at half-price.
Future of Social Media

FOMO to FUD (2021 to 2022)