
Double Top Pattern usually occupied by 2 peak of the price action followed by the weakness in momentum and volume on the way of making the second peak. see the Indicator (i use DMI, Volume Oscillator and Accumulation/Distribution Percentage Indicator) for quite clear divergence in recent price movement. "The advance off the lows usually occurs with low volume and meets resistance from the previous high " Cited from Stockchart.com regarding the weakness on making the 2nd attempt to make a 2nd top.
Based on Double Top Pattern, Around 9700 would be a neckline support to keep in watch for BTCUSD, While the target number cannot be exact, this pattern had a probability to bring the price down around 6400 area .
Invalidated this pattern once BTCUSD somehow breach from 2019 ATH with massive bullish momentum and volume.
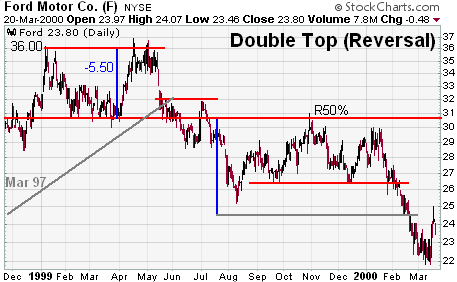
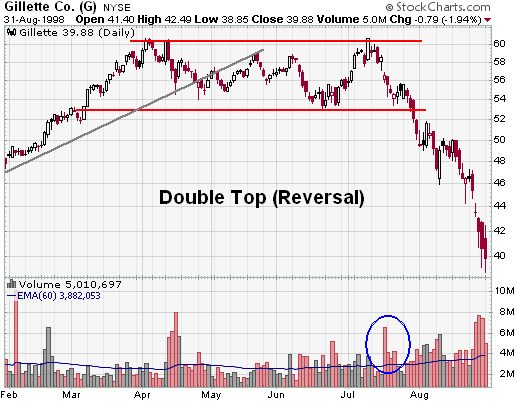
Double Top pattern example :
- [Bonus] I find this very interesting as the Greed and fear index also already touch the low point into "extreme fear" category, which is can be found average value on year 2018 while BTCUSD is getting decimated in price action.
Thank you for your time to read this post and please take this idea as a grain of salt as reality always differ from what i expect as this post merely just an opinion,
and please feel free to share what your thought on comment section.
peace.