Crypto Analysis #6
Hello there, @tradersaan is here, hope you all are doing very well. Today I am going to share the technical chart analysis of the pair ETHUSDT.
By the way I am swing trader in the Forex and Crypto, i.e., I hold my position for several days and take trade on H4, H1 or ocassionally at M30 timeframe. I use tradingview for chart analysis and take trade on MT4 and Binance. So the screenshot of charts I have shared in this post are all from tradingview.
I will go through the step by step process with price action along with multiple timeframe perspective.
Disclaimer: This post is not a trading mantra or get rich quick method, it is made only for educational purpose. I truely want to help others who want to learn Forex and Crypto trading and investing. Trading in the financial markerts involvs a lots of risk. I don't sell signal and don't recommend anybody to do signal trade. Sit back, do your own analysis and if you feel confidence, only then go ahead. Trading in the financial markets is a get rich slow and consistent process. It demands patience & long-term projection and hard work. So be aware of social media scammers.
Weekly Chart
Look, if you are a swing trader, you don't need that much of analysing the weely chart, but in a key level, all timeframes has an importance.
Look at the chart below, the 50 MA & 100 MA are aligned upwardly, i.e., the 50 MA is above the 100 MA which indicates the upward momentum. This means the investors of Ethereum are still in the market, though currently the price is in a range bound condition, i.e., the market is in indecision. Nonetheless, the market has still got the upward momentum clearly. And from July, 2020 (in the begining of the pandemic period), the ETHUSDT has started this upside rally, big investors are present here. Therefore, one should consider this pair only for buying for long term if a bit fundamental bias permits.
Conclusion: Buy Biased
ETHUSDT, W1, 50 & 100 MA are alinged upwardly
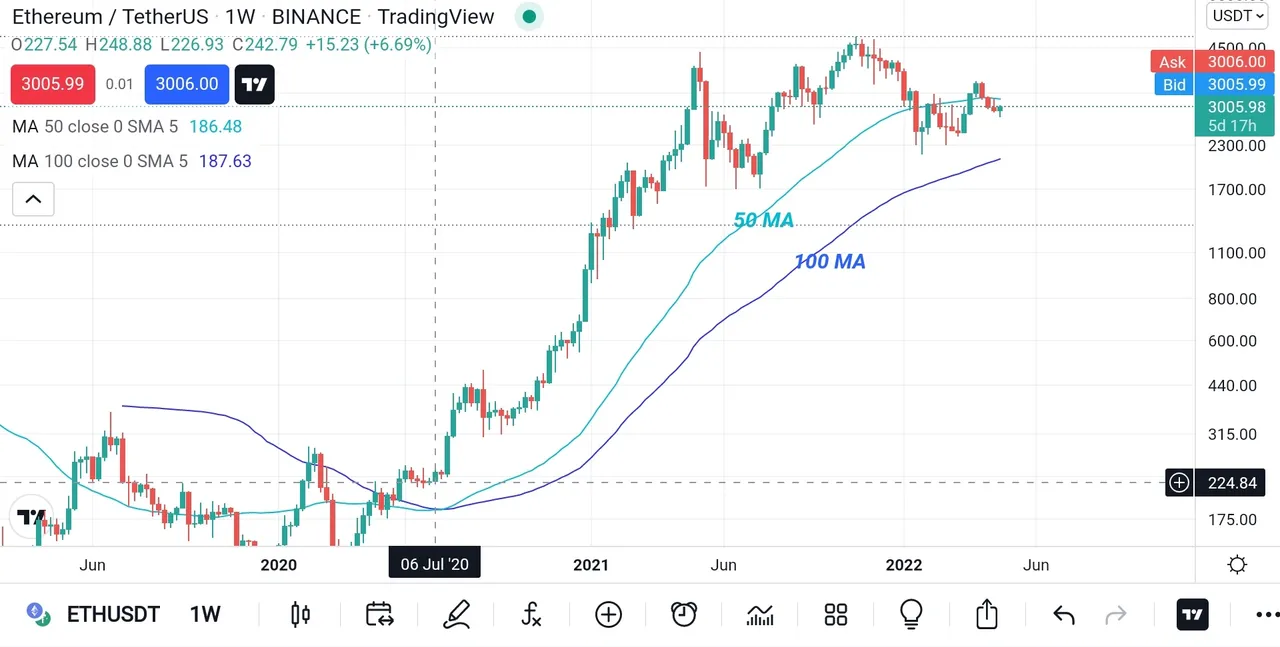
Image source: tradingview, prepared by me
Daily Chart
If we consider the daily chart of the ETHUSDT, we find the price is in a pretty uptrend channel and currently the price is right the lower line of the channel, weekly chart shows buyers are in the market. And in D1, the price is in a buy zone, if I would be a position trader, I would consider this level as a potential buy setup. But yes, one should also focus on the fundamental things if he/she wants to have long position for long term.
Note: when I say fundamental bias, then I mean to say that we should check macro economy and make a bias, suppose you find that ETH is stronger than USDT, then you are bullish on ETHUSDT. So in the technical chart you will only look for a key level to entry and exit with a healthy risk to reward ratio.
Anyway, look at the previous day candle, it is bull and got a clear rejection from the lower line of the channel. So price can either breaks the downward sloped line within the channel or comes back to the lower line again before it goes up. In either way we will buy this market.
Conclusion: Buy biased
ETHUSDT, D1, the price is in a uptrend channel
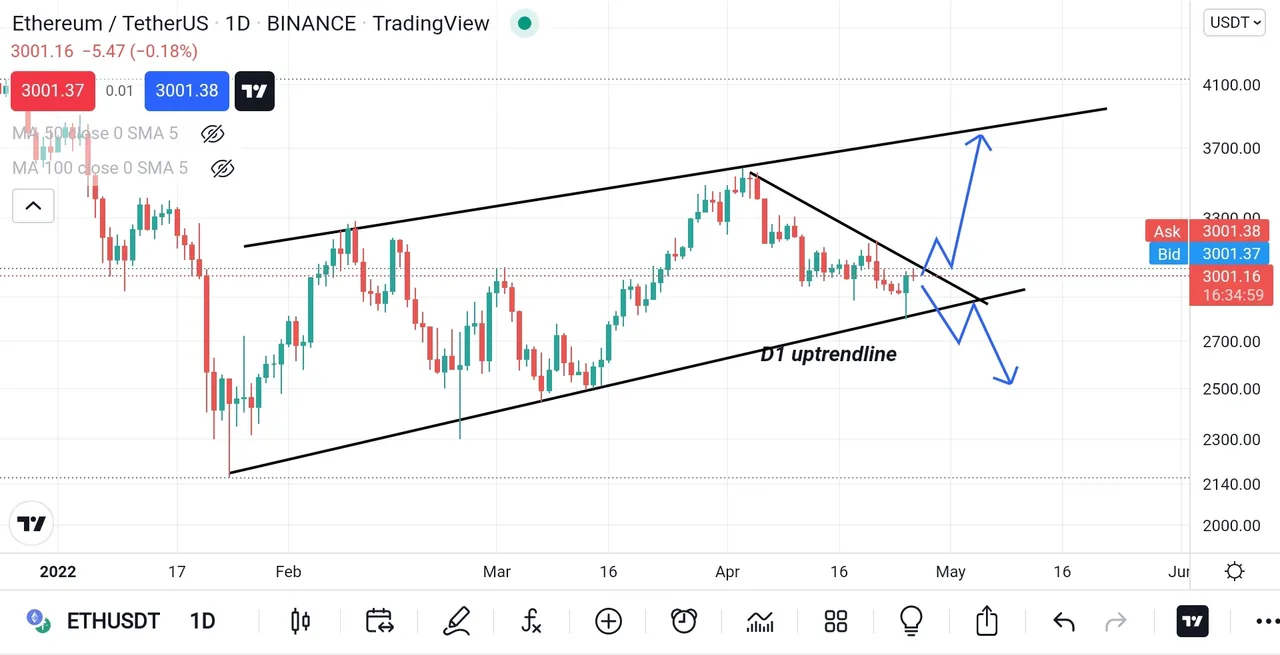
Image source: tradingview, prepared by me
Four Hourly Chart
If we see H4 timeframe chart, we see that the price is in a downtrend channel from the begining of this month April and this downtrend move is just a retracements move of the uptrend channel of the D1 chart.
Note: this is the beauty of multi timeframe chart analysis, when you do chart analysis in multiple timeframe perpsective, you grab the bigger picture of the market - like what long investors are doing, what medium term investors are doing, and what short term traders are doing. And when all the information you have on your hand, then you feel confident to open a trade as well as it increases the odds.
Well, In D1, the price could break the upper line of the down channel or could go down to the D1 uptrendline and from there the buyers are likely to get involved with a bit discounted price. My take here is that if price tests the D1 trendline(which is essentially the lower line of D1 up channel), then I will consider a long entry with my stop loss(at around 2760) just below the previous swing low or below the market structure and while my target profit will be at previous obvious swing high at around 3300, 3400, 3500.
ETHUSDT, H4, the price has completed the pullback move of the uptrend of D1
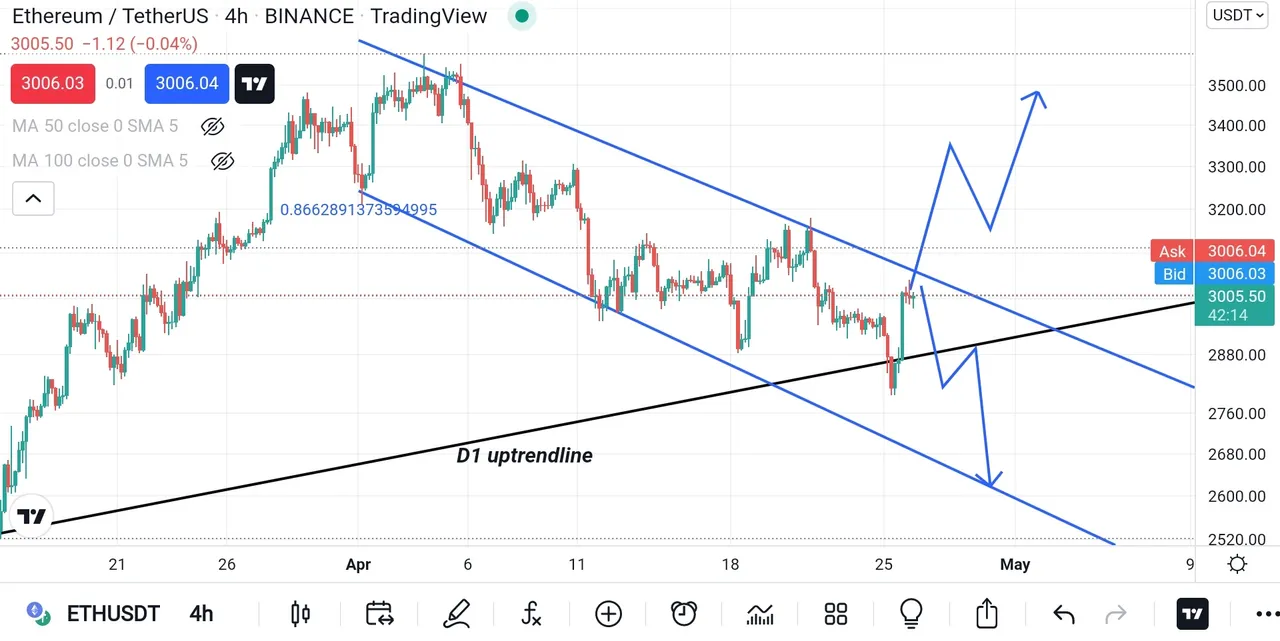
Image source: tradingview, prepared by me
One Hourly Chart
Whenever this type of uptrend, downtrend, channels scenarios happen in bigger timeframe, I always try to find the horizontal key level, i.e., support-resistance zone. Look at the H1 chart below, the price is in a minor resistance zone from where a sell pressures can come. But as the bigger timeframe chart says BUY, then we should wait for the breakout of the resistance or we should wait for the price go down to D1 uptrendline. If the breakout happens, then after completing the pullback move we will jump into for a buy position. By the way, if you don't know about the breakout pullback strategy, you can consider to give a read at
A complete guide of the Breakout-Pulback strategy for Trading
ETHUSDT, H1, my perception is that the price can go in those shown direction
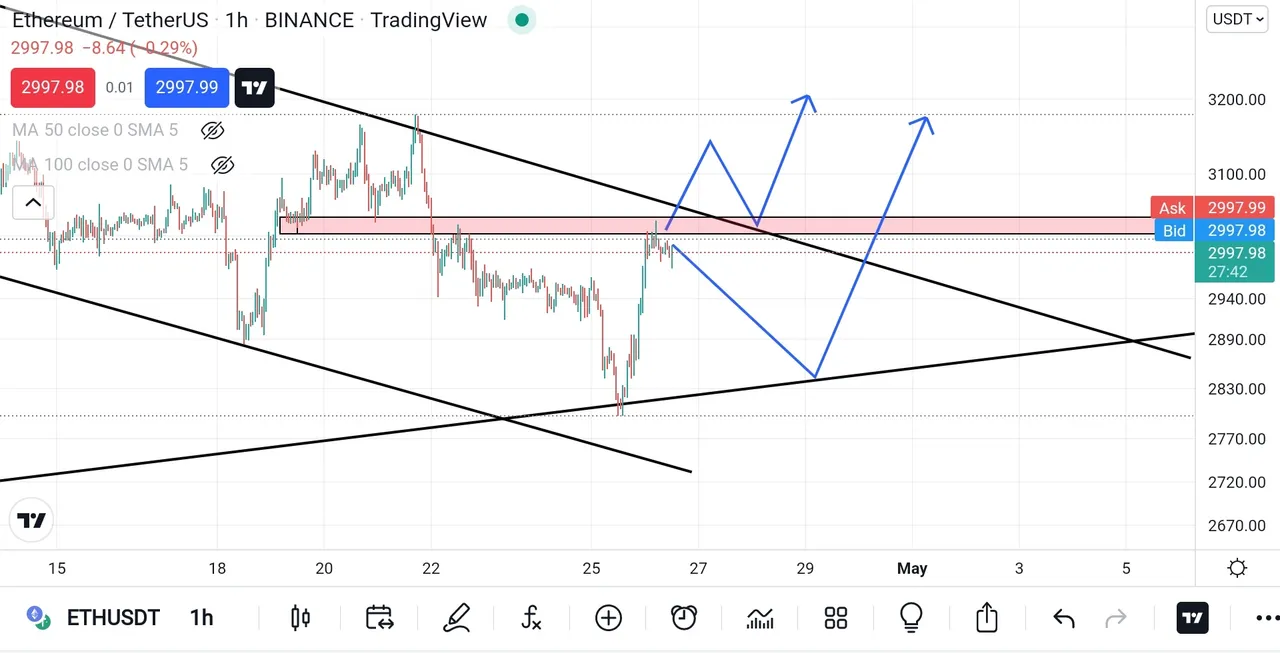
Image source: tradingview, prepared by me
30 Minutes Chart(M30)
In M30, the price is in a consolidation zone. Price often make this consolidation, when the market is in indecision mood, i.e., buyers or sellers- none of them are in control. And whenever the breakout of the consolidation happens, it shows the direction. Anyway, look at the chart below, if the price breaks this consolidation to the downside, the price is likely to test the D1 uptrendline OR if the price breaks upside of the consolidation zone, it is likely to continue the upside rally of the bigger timeframe.
Remember that if you are a short term trader like intraday trader, you can consider a sell trade in the downside breakout of M30 consolidation but your target profit should be at the D1 uptrendline.
Well, I will only look for the buy setup.
Here for two sceniarios -1. upside breakout; 2. downside breakout
By breakout-pullback strategy, the entry price is at around 3050 level, stop loss is at around 3000 level while the target profit is at around 3200 level.
I will wait for the price to test the D1 downtrend line and there I will open a buy entry. The entry price is at around 2820 level, stop loss is at around 2750 level while the target profit is at around 3000, 3200, 3400 level(depends on price action).
Both of them are valid for me. But I like the second scenario most.
ETHUSDT, M30, consolidation
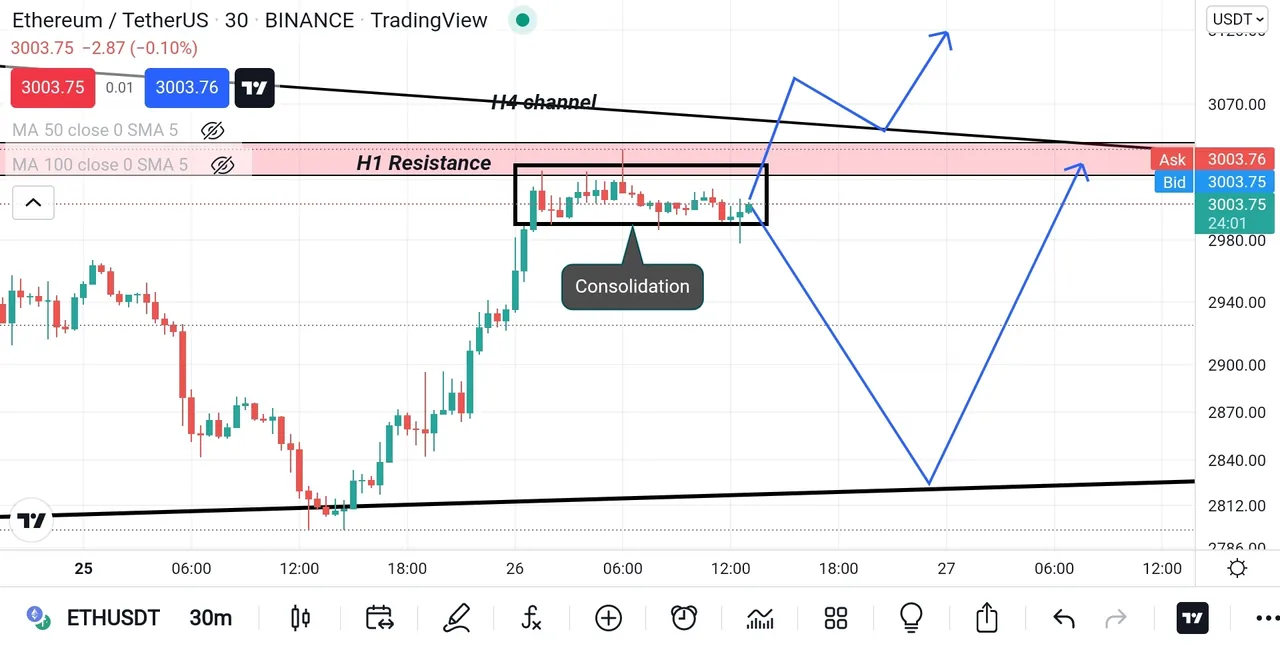
Image source: tradingview, prepared by me
Note: If the price breaks the lower line of the D1 up channel, then this buy set up is INVALID.
And I repeat that do your own analysis. This post is just for a demo pupose which should help you to understand the multi-timeframe analysis with price action. Hope it helps.
Well, this warps up for today, I will come up again with another trading ideas.
Thank you so much if you make it to the end. Feel free to comment what you feel about this pair ETHUSDT.
And it will really be great if you show some supports by giving me upvotes.
Thanks!!!
By @tradersaan