Trading Strategy #1
Breakout-Pullback strategy
Hello there, @tradersaan is here, hope you all are doing well. Today I am going to share one of my favourite price action trading strategies which is called Breakout-Pullback Strategy. This strategy can be used in any techinical charts of any market like Forex, Crypto, Commodities, Share, Stock, Options etc. And also for all timeframe this strategy or concept is valid. Well, I will go through step by step process of the anatomy of this strategy.
Firstly we need to know the definitions of some terms like - Support, Resistance, Uptrendline, Downtrendline. Let's start.
Support Zone
A zone is called a support zone if the price bounces back up when it touches that zone. A support is an area or zone - not a line or level because one singal price level cannot be that significant from where the price wil bounce back up. Now the question is that how one should draw support area. Well, we have to find an area from where the price has bounced back up atleast twice or thrice, more the times more the significant it is. And also, more the higher timeframe more the significant it is, i.e., the support zone of H4 will be much more significant than that of M15.
ETHUSDT, H4, support zone
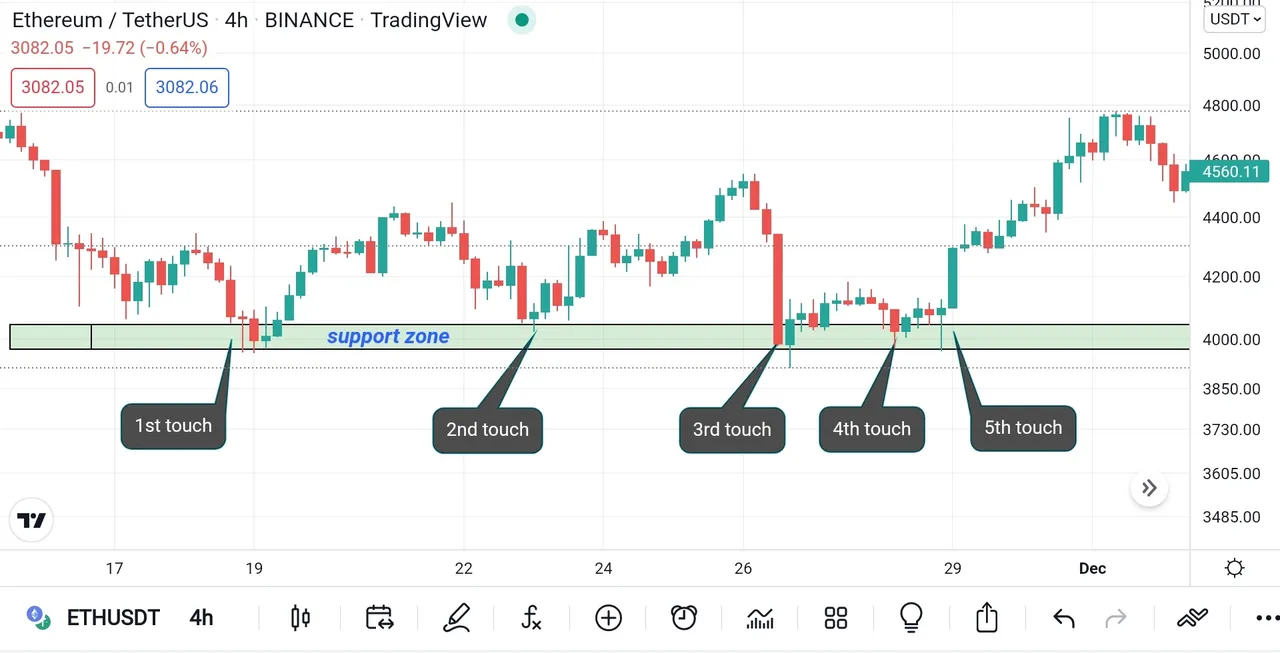
Image source: tradingview, prepared by me
Why does the price bounce back up when it visits the support zone?
Well, the psychology of the support zone is that when the price comes to a certain level, many buyers percieve this level as a good buy zone as previously when the price has come to this level, the buyer's reaction was good - meaning the price has gone up, there are people who want to buy in this price. That's the reason the price goes up when it tests the support area.
Resistance Zone
A zone is called resistance zone if the price bounces back down when it touches that zone. A Resistance is an area or zone - not a line or level, because one single price level cannot be that significant from where the price wil bounce back down. And to draw a resistance zone one should find an area from where the price has bounced back down atleast twice or thrice more the bouncing times more the significant it is. And also, more the higher timeframe more the significant it is, i.e., the resistance zone of D1 is much more significant than that of H1.
BTCUSD, H4, resistance zone
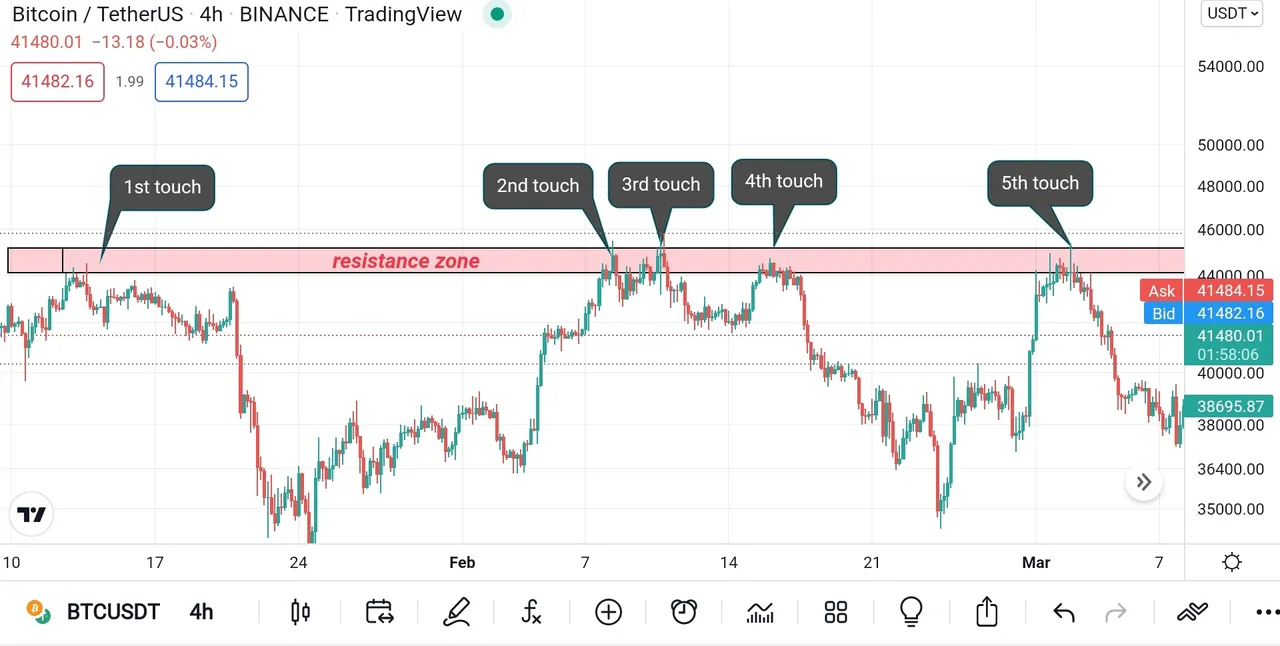
Image source: tradingview, prepared by me
Why does the price goes down when it visits the resistance zone?
Well, the psychology of the resistance zone is that when the price comes to a certain level, many sellers percieve this level as a good sell zone as previously when the price has come to this level, the seller's reaction was good - meaning the price has gone down, there are people who want to sell in this price. That's the reason the price goes down when it tests the resistance area.
Trendline
Uptrend Line
In an uptrend market, the price makes higher highs(HH) and higher lows(HL) and often the price is supported by an upper sloped line or in other way, one can draw a line connecting all the obvious higher lows - this line is called Uptrend Line.
So, when the price tests this uptrendline, it's likely to go up as it has done so before. The uptrendline is significant when it is tested twice or more before. And also more the higher timeframe more the significant it is.
SHIBUSDT,H1, uptrend line
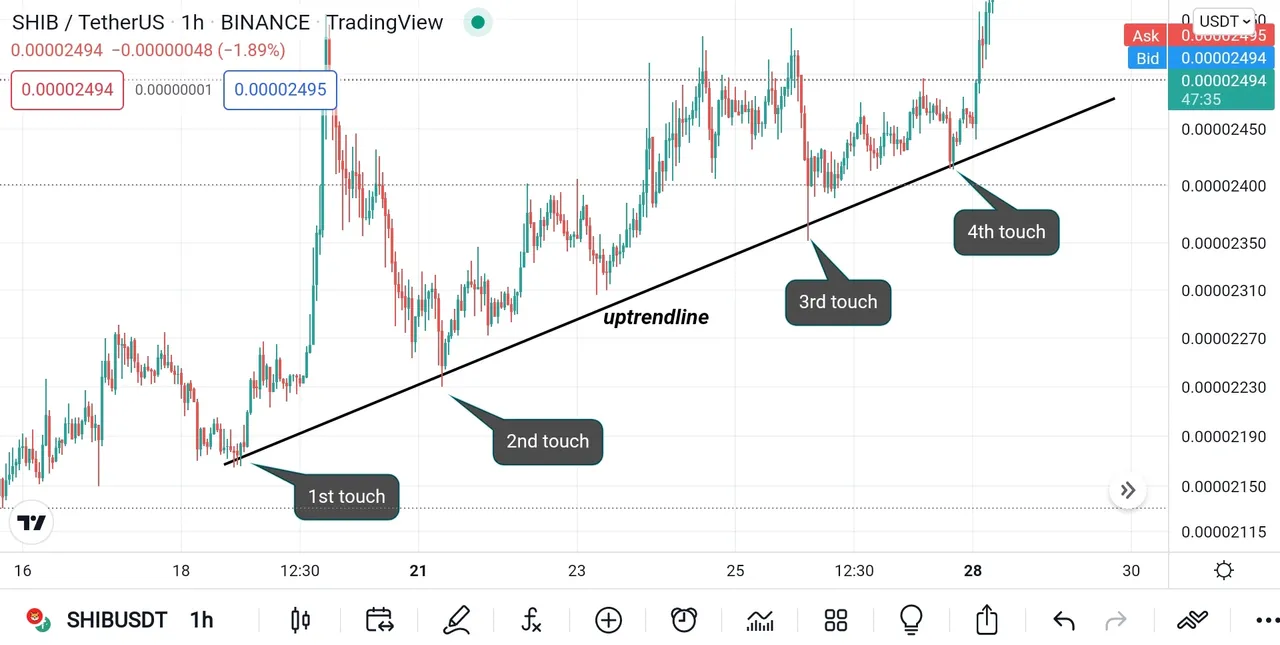
Image source: tradingview, prepared by me
The psychology of uptrendline is that when the price comes to the upward sloped line, buyers' percieve this as a buy zone as the price has completed the retracements move to the uptrendline and now it is ready to go with the orginal upward momentum
Downtrend Line
In an downtrend market, the price makes lower lows(LL) and lower highs(LH) and often the price is resisted by a downward sloped line or in the other way, one can draw a line connecting all the obvious lower highs - the line is called a Downtrend Line. So, when the price tests this downtrend line, it's likely to go down as it has done so before. The downtrend line is significant when it is tested twice or more before. And also more the higher timeframe more the significant it is.
SHIBUSDT, H4, downtrend line
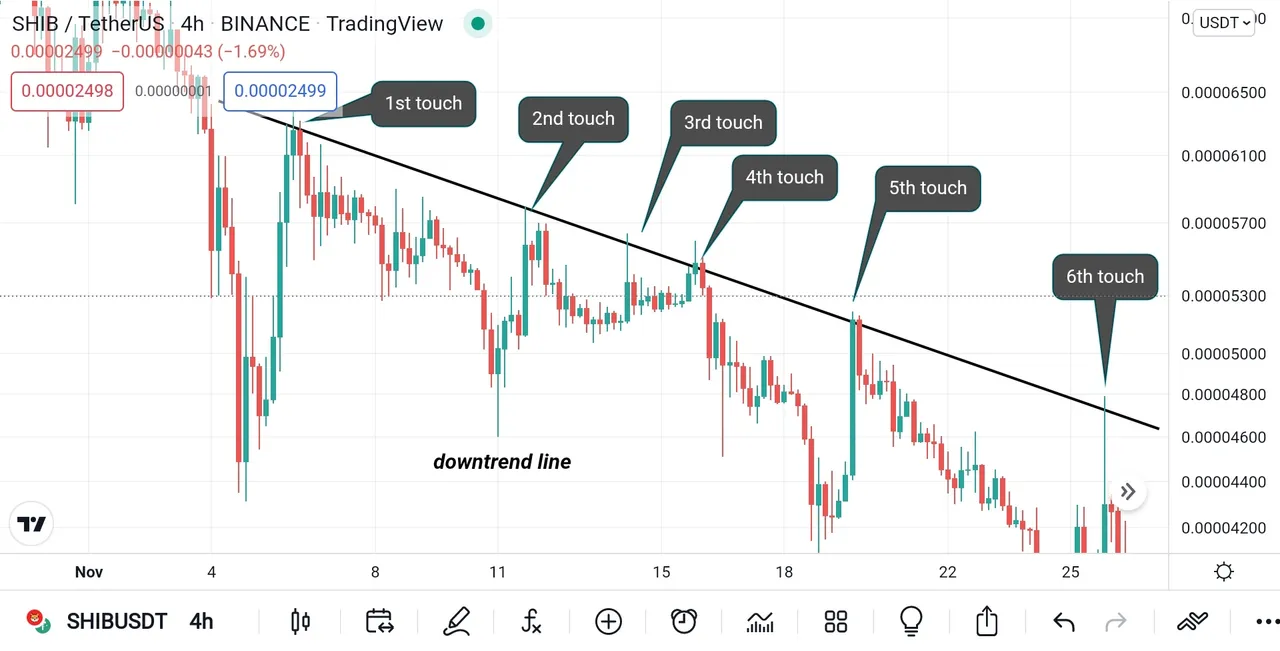
Image source: tradingview, prepard by me
The psychology of downtrend line is that when the price comes to the downward line, sellers' percieve this as a sell zone as the price as completed the retracements move to the downtrend line and now it is ready to go with the original downward momentum.
Breakout
Now that we have defined support, resistance & downtrend, uptrend line; let's know about the breakout of these area.
- Breakout of Support Zone: If the price goes down through a support zone and the following candle closes below the support area, then it is called a breakout of support zone. This breakout candle is often a big volumed candle. And this indicates that the sellers are so much in control that the buyers couldn't stop them when the price has come to this support zone. As a result the breakout of support area has happened.
XAUUSD, H4, the breakout of the support zone
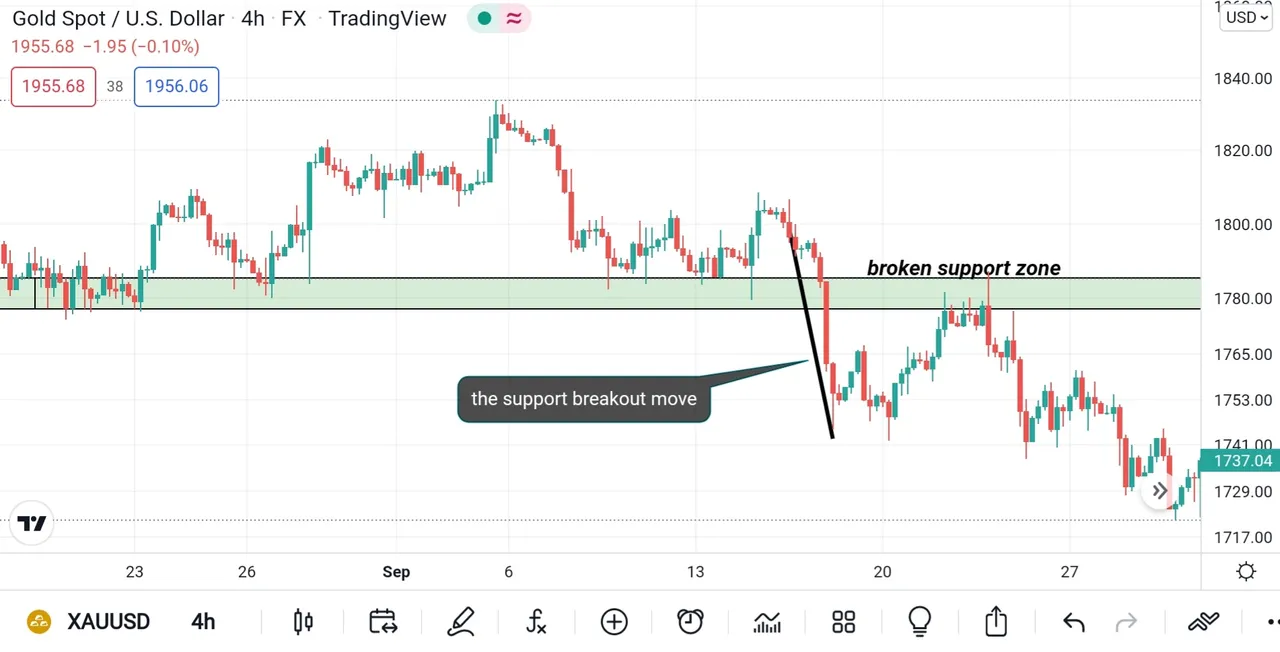
Image source: tradingview, prepared by me
- Breakout of Resistance Zone: If the price goes up through a resistance zone and the following cand closes above the resistance area, then it is called a breakout of resistance zone. This breakout candle is often a big volumed candle. And this indicates that the buyers are so much in control that the sellers couldn't stop them when the price has come to this resistance zone. As a result the breakout of resistance area has happened.
XAUUSSD, H4, the breakout of resistance zone
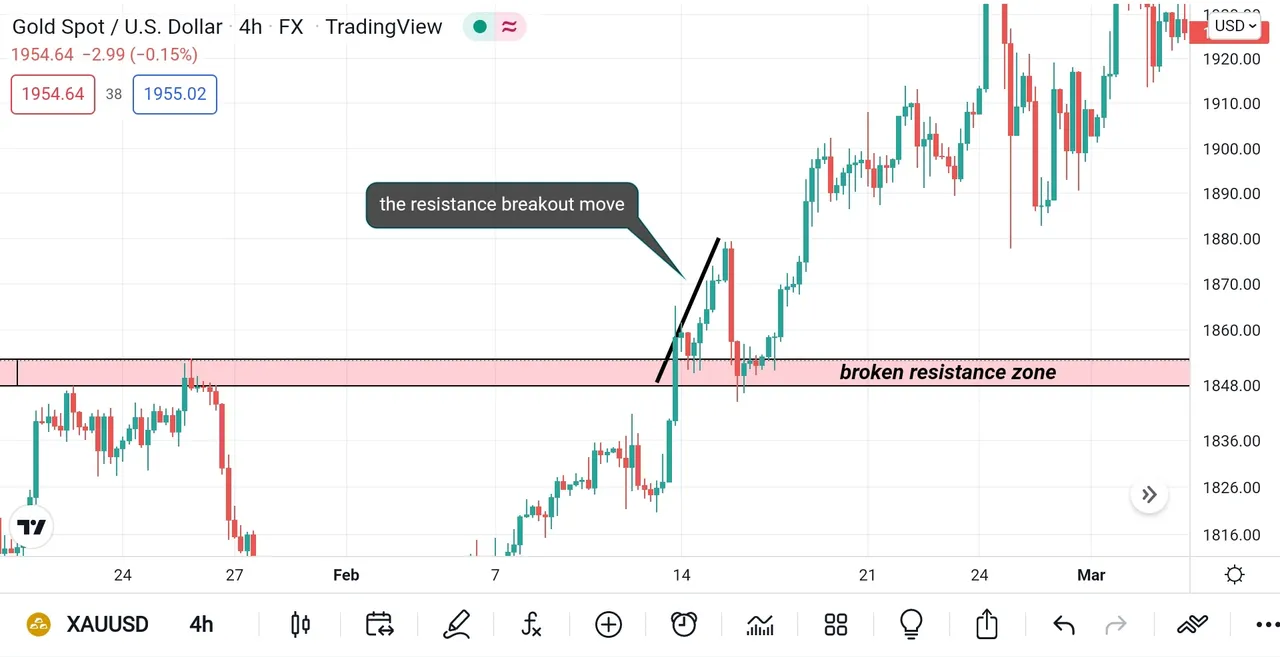
Image source: tradingview, prepared by me
- Breakout of Uptrend Line: If the price goes down through a uptrend line and the following candle closes below the uptrend line, then it is called a breakout of the uptrend line. This breakout candle is often a big volumed candle. And this indicates that the sellers are so much in control that buyers couldn't stop them when the price has come to this uptrendline. As a result the breakout of the uptrend line has happened.
SHIBUSDT, H4, the breakout of the uptrend line
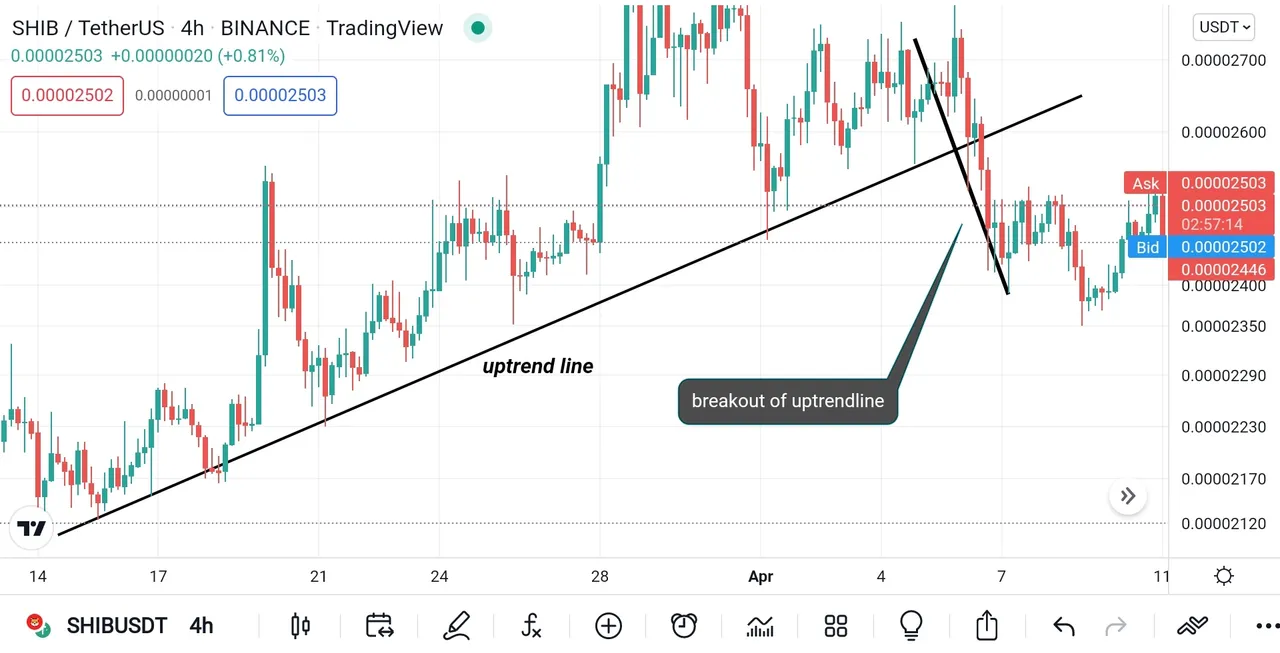
Image source: tradingview, prepared by me
- Breakout of Downtrend Line: If the price goes up through a downtrend line and the following candle closes above the downtrend line, then it is called a breakout of the downtrend line. This breakout candle is often a big volumed candle. And this indicates that the buyers are so much in control that the sellers couldn't stop them when the price has come to this downtrend line. As a result the breakout of the downtrend line has happened.
BTCUSDT, H4, the breakout of the downtrend line
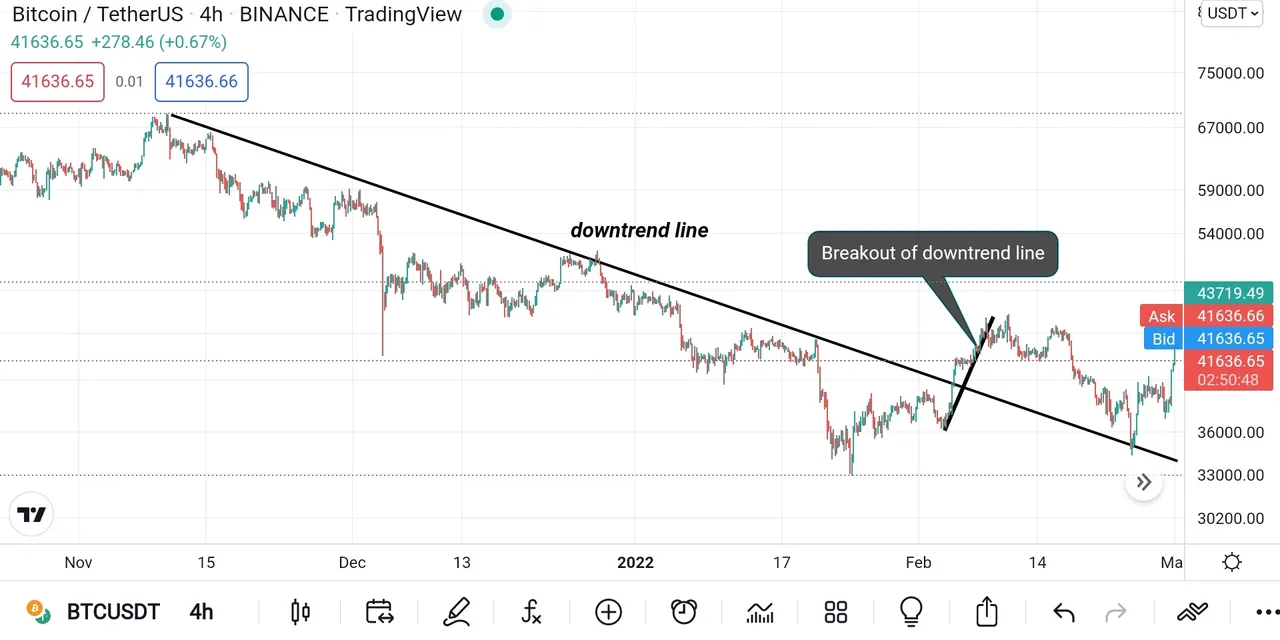
Image source: tradingview, prepared by me
Intentionally, I have written these concepts with the same pattern so that it can be easy & time-saving to grab this idea
The Science behind the Breakout Move
Now that we know what breakout is. Let's dig in a bit.
Firstly, the price is supposed to go down when it comes to a defined resistance zone. But what if the price goes through the resistance zone and closes above it. This means buyers has stepped into the market and they are willing to buy the market in the higher rate. And those sellers who used to sell in this price, they loses their control and starts becoming buyers.
Secondly, in a resistance zone, many traders go short - they are sellers and their stop loss is approximately above the resistance zone. And these bunch of stop loss is hit when the price makes a breakout of that resistance zone. Automatically they become buyers.
XAUUSD, H4, the stop loss of sellers' are hit and they become buyers
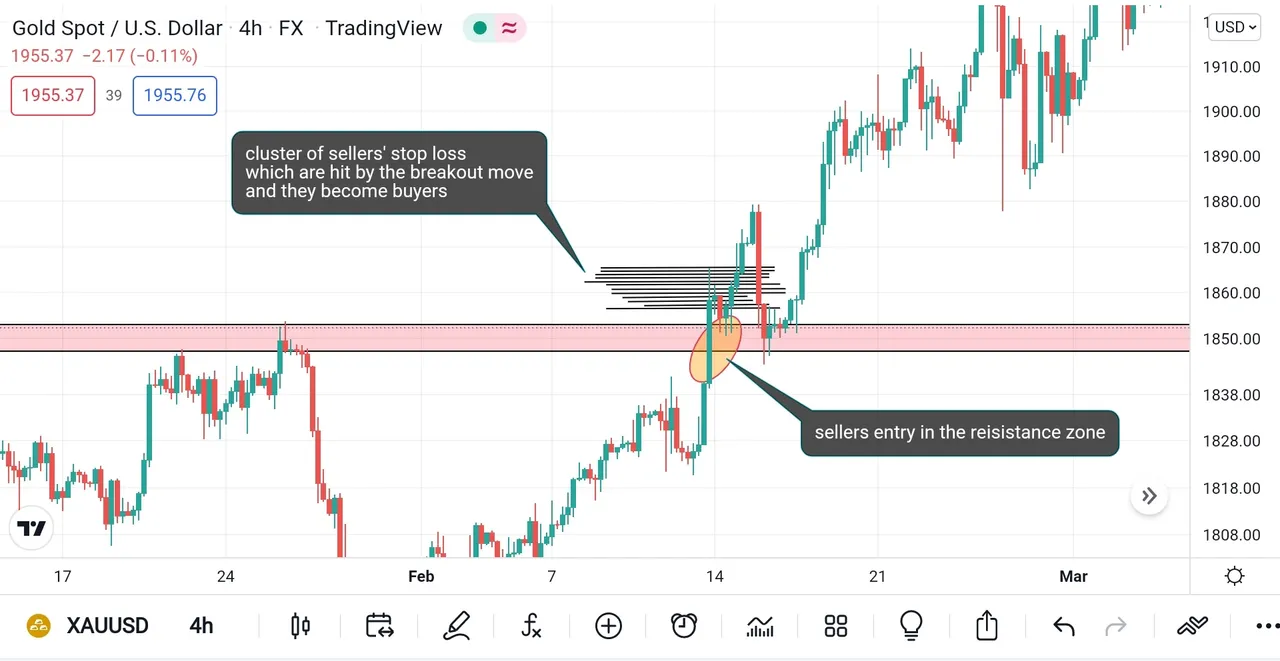
Image source: tradingview, prepared by me
The concept is similar with the support zone, uptrendline and downtrend line, take it as homework
The Pullback Move
The Pullback Move of the Support Zone:
After the breakout of support zone the price often comes back to the broken support zone to restest it - this is called pullback or retracements or correction or profit taking move. The sellers who has short the market before breakout, they often book their profit and exit after the breakout, that is the reason behind this pullback move.
XAUUSD, H4, pullback move to the broken support zone
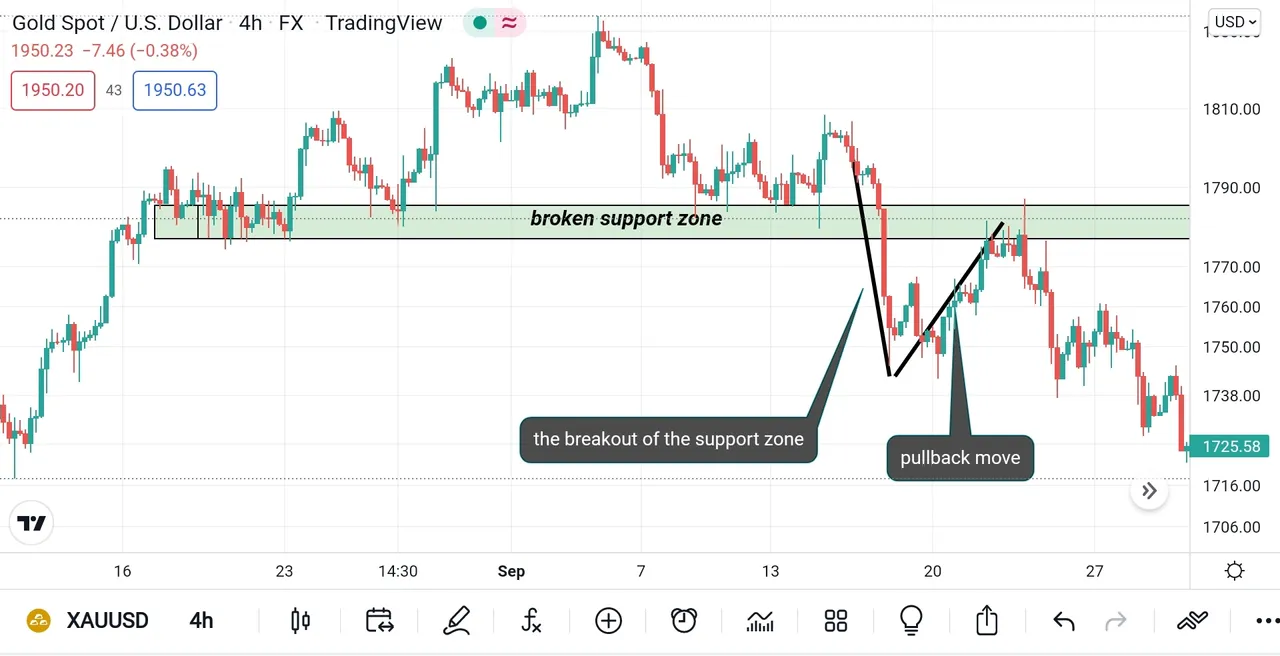
Image source: tradingview, prepared by me
The concept is similar with the resistance zone, uptrendline and downtrend line breakout, I will leave this for readers
This pullback move don't always come back to the exact the broken support zone. So how can one take a gauge about the pullback move. Well, for this, the trading tool Fibonacci Retracements can be used as the levels of it are very important psychologically. The levels like 23%, 38%, 50%, 61% and 78% are very significant. The 50% level isn't not of the fib retracements level, by the way. And the zone between the 50&61% is called the Fib Golden Zone.
Note:
- If the market is in an aggressive uptrend, the price is likely to test 38% level in its pullback or retracements move. Aggressive traders like this level to enter into the market.
- If the market is in an less aggressive uptrend, the price is likely to test 50&61% level in its pullback or retracements move. Conservative traders like this level or golden zone to enter into the market.
- If the market is in an healthy uptrend, the price is likely to test 78% level in its pullback or retracements move.
I personally like the golden zone to enter into the market.
How to draw the Fibonacci Retracements tools?
Well, for a support breakout scenario, we should draw the fibonacci from previous obvious high to the low of breakout. See the demonstration below for a clear understand.
XAUUSD, H4, a fib is drawn in a support breakout scenario, look, how price is resisted by the golden zone of the breakout, that's where a short entry can be considered
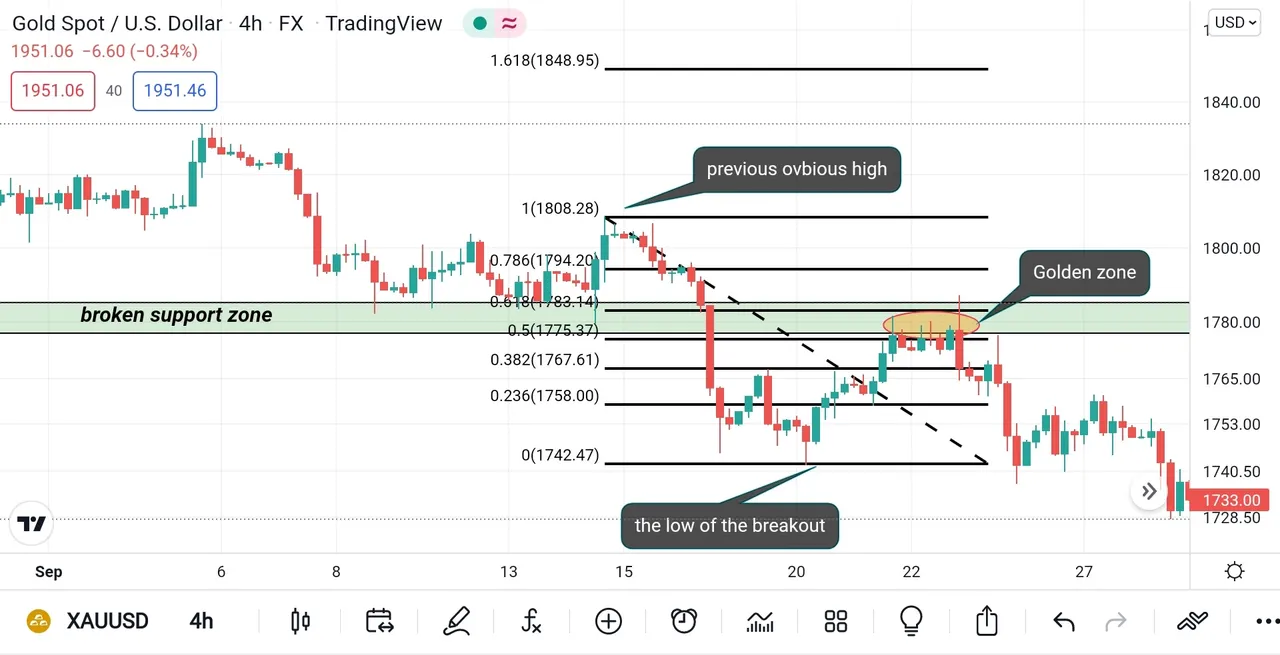
Image source: tradingview, prepared by me
The Complete Setup
In a support breakout - pullback, we go short. The stop loss is just above the broken support zone and the target profit is somewhere at the next previous support zone with a good risk to reward ratio. Personally, I prefer to trail my stop loss. Trialing stop loss is something that you move your stop loss to the profit side when the price goes in your favor.
In a resistance breakout-pullback, we go long. The stop loss is just below the broken resistance zone and the target profit is somewhere at the next previous resistance zone with a good risk to reward ratio.
In an uptrendline breakout-pullback, we go short. The stop loss is just above the horizontal support in the adjacent of the broken uptrendline and the target profit is somewhere at the next support zone or key level from where the price could find some buyer's pressure. Try to manage a healthy risk to reward ratio always.
In a downtrend line breakout-pullback, we go long. The stop loss is just below the horizontal resistance in the adjacent of the broken downtrendline and the target profit is somewhere at the next resistance zone or key level from where the price could find some seller's pressure.
XAUUSD, H4, buy entry by resistance brekout-pullback strategy
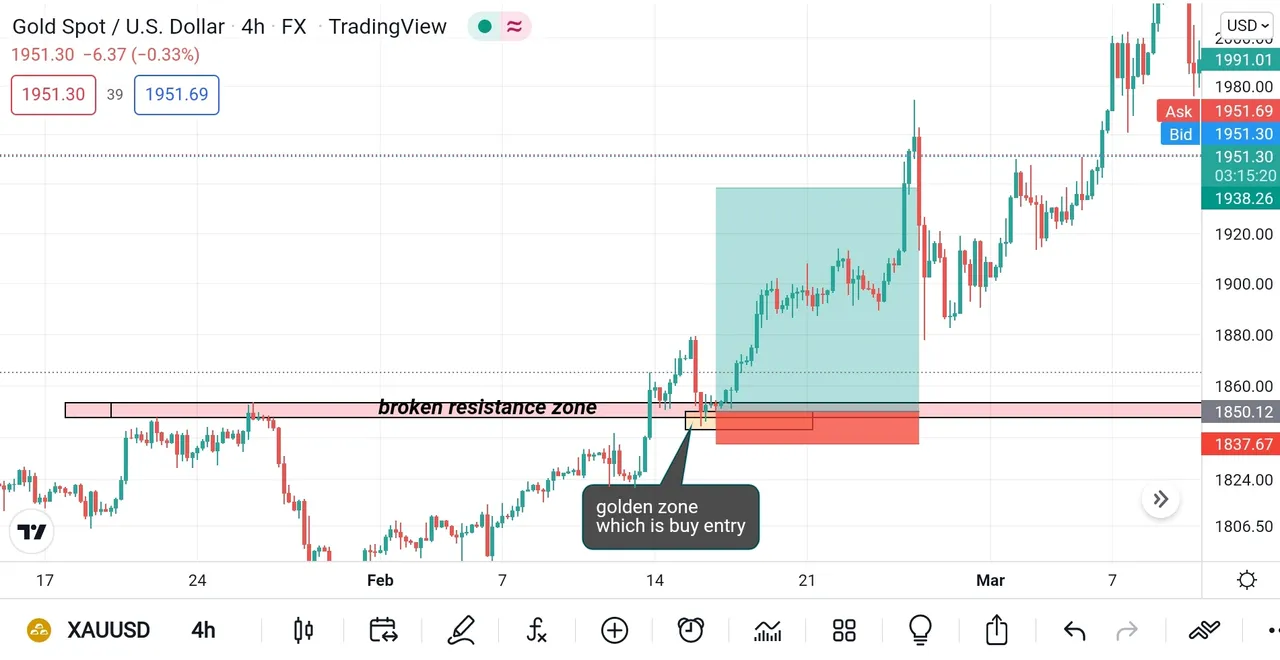
Image source: tradingview, prepared by me
False Breakout: The Danger
Well, every breakout is not a true breakout, meaning after the breakout, suddenly, the price comes back and goes in other direction - this breakout is called a false breakout. Sometimes, for the manupulation and fundamental reasons, this false breakout is happened in the market. So you mix up this strategy with a little fundamental confluences, this problem can be sloved. Try to know what's going on out there in which pair you are going to trade.
Also one can use volume indicator to see the volume of the breakout candle. More the volume in the breakout candle more it is likely to be true.
Disclaimer
Don't ever apply to the real market whatever you find in the internet - same goes with this contest. Back-test it thoroughly to know the edge of this strategy before you put real money. If you back-test it, you will have the entire keys on your hand and you will be very confident upon this strategy. I repeat don't use this concept with your hard earned money before back-testing.
Hope it helps. Feel free to comment if you have any quarry or if you want to suggest some changes here.
Thanks if you make it to the end
Happy trade
by @tradersaan