
Direct from the desk of Dane Williams.
Since GBP/JPY rejected off daily support and gave us an opportunity to short for a 1:3 profit, it's been all downhill for the beast.
But here we now are a month later at the next daily support/resistance zone that puts the pair in play. Take a look at the beast daily chart below.
GBP/JPY Daily:
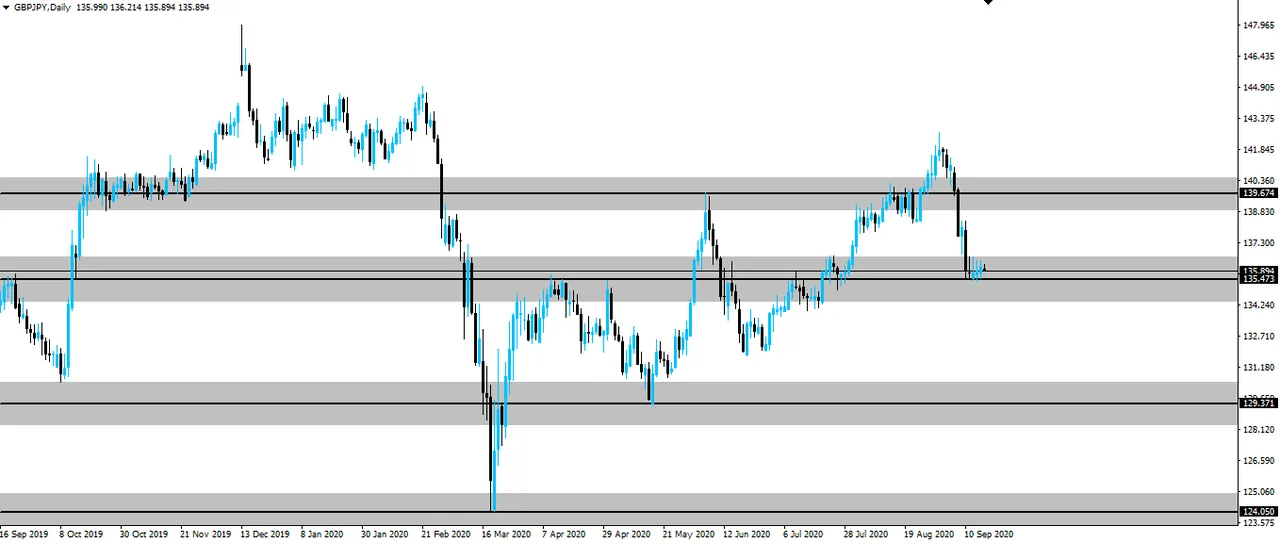
What's really caught my eye about this one is the recent GBP/JPY price action.
It's a bit rough on that zoomed out MT4 chart, I know. But if you bring it up on your own charts, you'll see the most recent cluster of indecision candles that has formed right on top of our zone.
I can't stress enough here that contrary to popular opinion, dojis mean nothing more than indecision between bulls and bears. They're not yet a signal of a reversal until we get confirmation that in this case the bears have lost control.
Don't get caught out.
Best of probabilities to you,
Dane.
FOREX BROKR | Hive Blog
Higher time frame market analysis.