
Direct from the desk of Dane Williams.
Monday morning (well evening now in Aus), and I'm back at the my desk in front of my charts. After flicking through my MT4 watchlist, there is one market that stands out... and that's the beast.
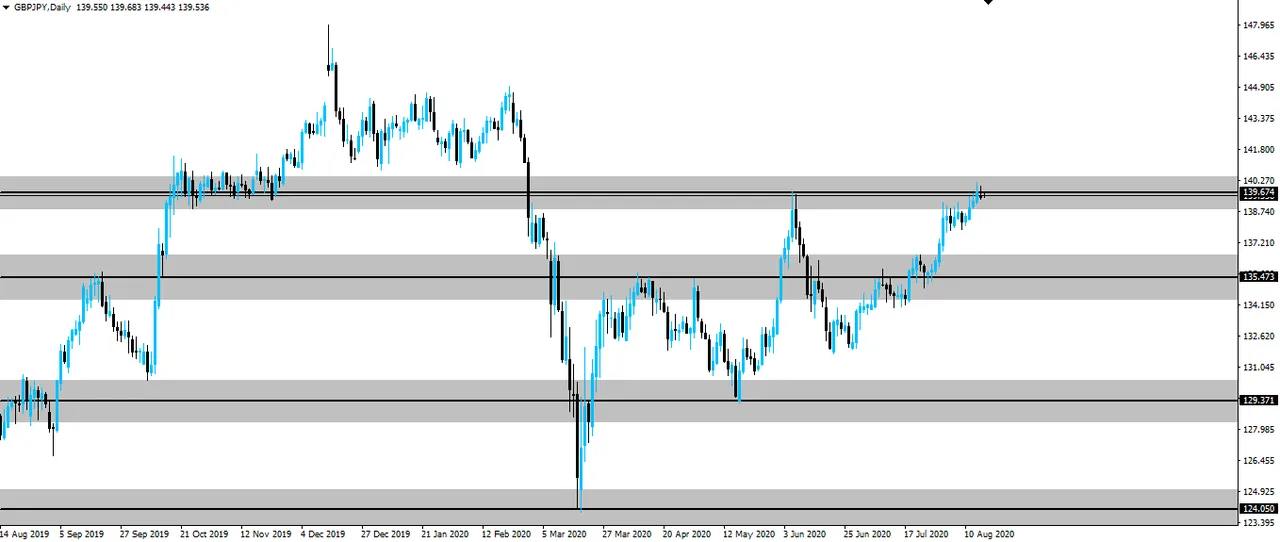
After trading the GBP/JPY gravestone doji at the last daily resistance zone, price has since moved up to the next. A zone you can't miss on the beast daily chart below.
GBP/JPY Daily:
The blog I linked to in the paragraph above is an interesting one because it shows a setup that right now looks like it failed. At the time however, it paid us an easy 1:3 risk:reward and didn't even bother to look after taking profit.
So on we move to the next higher time frame resistance zone that as I already said, you can clearly see on the daily chart. With price below resistance on the daily, we're also looking for a retest of intraday support turned resistance in order to get short.
Now we zoom into an hourly and look for that short term support zone we can use as an entry.
GBP/JPY Hourly:

With price on the way down, we found the first hourly candle that finds support and look to short a retest back into it as resistance. Another clear entry you can see marked here.
If you're conservative, place your stops above the higher time frame zone. If you're aggressive, place your stops above the intraday zone.
It's the same setup, day after day after day...
Best of probabilities to you,
Dane.
FOREX BROKR | Hive Blog
Higher time frame market analysis.