I recommend first checking this index of related posts, before giving this one a read.
Introduction to my journey learning technical analysis so far.
Thoughts about risk management and calculating position sizes based on our risk tolerance.
Journaling is a necessary step in one's trading journey because having a journal will allow us to realize what are we doing right or wrong, our weaknesses and strengths, as well as identifying patterns that repeat.
In my opinion, a good journal should have all the information related to our reasons for entering a trade, but it also should work as some type of database where we can check our own results. The most common factor to measure one's results as a trader is abbreviated as RR.
What is RR?
RR is risk to reward ratio and it is the best way to measure how successful the trade was. It compares your determined risk with the reward you obtained. For example, a trade where you risk 100 dollars and you end up winning 300 dollars resulted in a positive 3RR. A trade where you risk 1 dollar and lose 1 dollar has a -1RR.
RR is used to determine how good or bad you are doing regardless of whether you trade with a lot of capital or with little capital. Plus, comparing the RR between different strategies can also be very useful.
Why not use mere percentages instead of RR?
You can certainly use mere percentages to see how good you are doing and using percentages in conjunction with RR can be good. But, RR can be more valuable for active traders because it takes into account the risk you are assuming and the results you are achieving in relation to your accepted risk.
Winning 20% for example doesn’t mean much if there is no information about how much were you willing to lose in order to achieve that gain. However, winning 20% when you were willing to lose 10% would be a cool 2:1 in RR terms. Winning 20% when your risk was 80% of your position wouldn't be so good unless you have an incredibly high hit rate.
Using RR also makes it easier to remain psychologically neutral when analyzing any type of result. Tradingview has a long and short tool that makes it easy to check the theoretical RR of any trade you are thinking of taking in either direction.
Now that some basics about RR have been explained, let’s talk about journaling and my own custom journal.
All the journals I have used have been with excel spreadsheets. I began with a basic sheet I download from Binance academy I believe, I modified some of its columns and that was it. This journal only had columns for basic things like date, position size, manual input for final RR, etc. I had to manually input everything and sometimes it was a pain in the ass to do so.
It wasn’t until @mindset_BTC shared his excel journal that I realized how much valuable information I could include in it. His journal had some cool new ideas using more advanced excel functions and when I saw all of this, I decided I could make this journal even better. I had to learn about how to use some excel formulas I knew nothing about at the time, but in the end, I was able to modify the journal and added a bunch of new stuff such as:
More automatic calculations. A lot of relevant data about the trades is calculated automatically once the basic information is entered. I added as much automatic calculations as I could in order to reduce as much as possible the manual input of information.
Average final RR when a single trade has multiple exits. I struggled with this in the past, but with my sheet called “averager”, this is now super easy to handle.
Average RR, win rate, and win/loss ratio per strategy. Having these calculations per strategy instead of just in general, can make it easier to see what is working and what isn’t working. By the way, the win rate is simply winning trades divided by total trades. Win/loss ratio is just winning trades divided by losing trades.
Historic average RR, win rate and win/loss ratio per strategy. After creating the calculators per strategy, I realized that taking into account the trades from previous months or periods was important as well, so I added this new calculator that requires manually entering some accumulated data from the previous month/period but it is fast and easy and having historical data presented this way is extremely valuable.
Once I was done with all of these modifications I finally felt like I had a complete journal template. Ideas like including average RR for trades with multiple exits, or average RR, win rate, and win/loss ratio PER strategy are things I have never seen included in the journal templates shared in many places on the internet. I added them due to my own need for them and so far, I believe this is the only journal shared out there that includes them. You can find it here.
I will now proceed to briefly explain what you will find in the journal using screenshots:
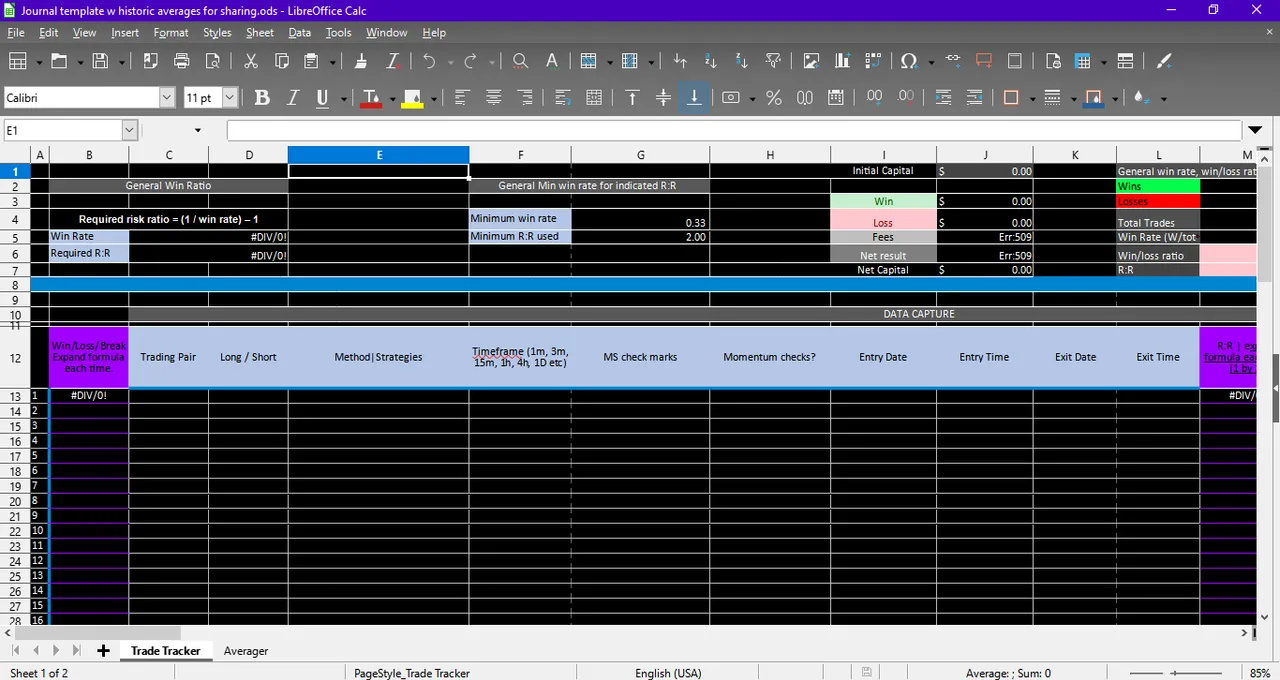
At the top:
In columns B-C-D there is a simple calculation that automatically takes your general win rate, and gives you the minimum RR per trade you should achieve in order to not lose money.
On the right, there is another small calculation, where you input a RR and it gives you the win rate you should achieve in order to not lose money if you always place trades with that RR measurement.
More to the right, there is a small calculator involving your capital, wins, losses, etc.
Below, we see part of the main table where the information is entered. 1 row per trade.
The pink columns have formulas in them, and you need to expand the formula for the new row only when the new trade is finished. Expanding them before the trade is finished will confuse the calculators.
In the Win/Loss/Break Even column, I added a formula that indicates a W, L, or BE based on the resulting R:R of the trade. The limits are -0.05 RR & +0.05 RR. You can change the formula or simply write "Win", "Loss" or "Break Even" for the calculators to work properly. If you aren't going to use the formula then make sure to write those words without blank spaces, otherwise, the calculators won't recognize them.
If you change the formula, I would appreciate it if you explained to me your reasoning for this change.
The -0.05 RR & 0.05 RR range for defining L, BE, and W, is also used for the R:R's cells' background colors. This can be modified in Format - Conditional if you use LibreOffice.
Some columns have predefined lists and they can be modified if you want. The most notable example is the strategy column, in this column, I only entered letters but you can change this and include the name of the strategies you use. These columns and their names are important because the calculators per strategy use this information to filter the trades they need to include.
I use LibreOffice so in order to change options in predefined lists I select the cells, and then go to Data-Validity and that's it. Make sure you don't leave blank spaces on the list, because the calculators won't be able to filter the trades properly if there are blank spaces. The same happens when modifying the formulas in the calculators per strategy and exchanging the letters for your preferred strategy names. However, you can use the search and replace option to make these modifications much faster.
The momentum checks column is empty and has no predefined list because I haven't decided yet if I will use it, and which options to include.
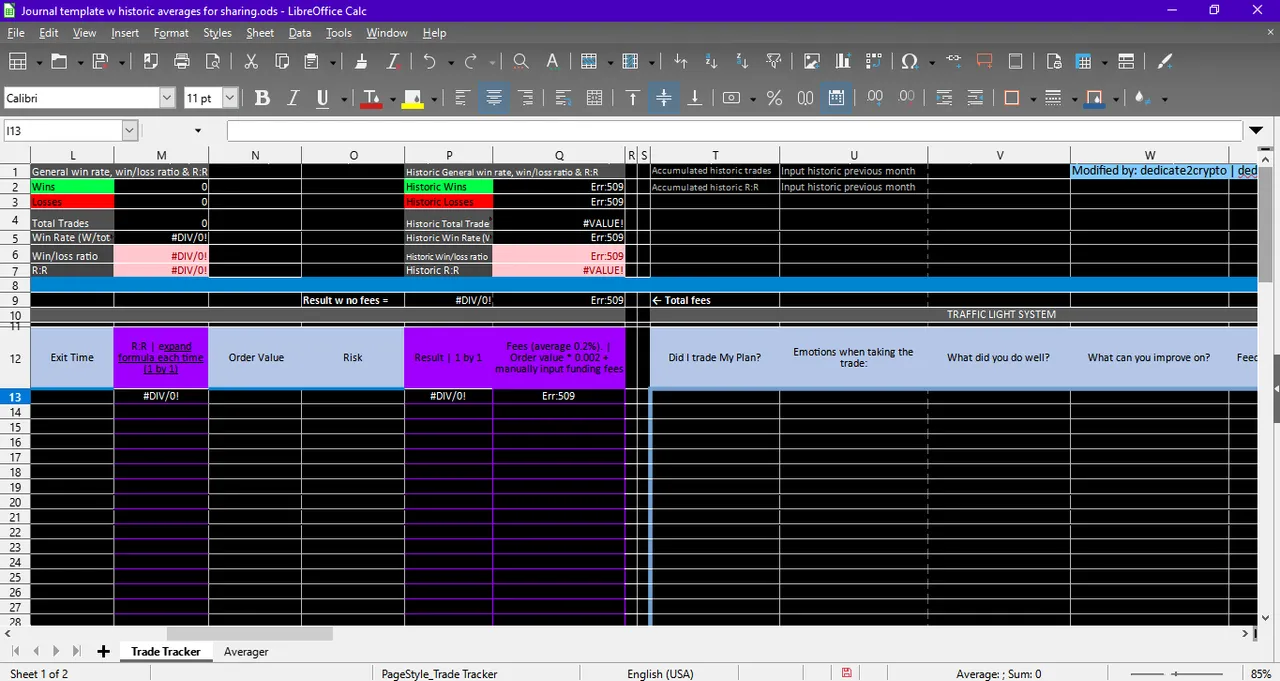
More to the right, and at the top, we can check the general calculator that provides us with the general average RR, win rate, and win/loss ratio. This calculator fills up automatically when completing the information in the general table below, including the pink columns with automatic formulas and the averager sheet.
To its right, there is the historic general calculator which makes it easier to include our results from previous periods. In this calculator, you do need to manually enter 4 numbers.
In the historic wins and historic losses formula, I wrote which data you need to manually include as a reminder. In both cases, you need to include the total historic wins and losses from the previous period. The addition is already there in the cell, but the data from the previous period needs to be manually entered.
In the same way, the accumulated total trades and historic general average RR as per the previous period also need to be manually entered in the grey cells next to the historic calculator.
Entering these 4 manual numbers allows the historic calculator to provide us with results taking into account all of our total registered trades up to that point.
This same process needs to be done with each of the calculators per strategy. In order for each historic calculator to work, 4 numbers from the previous period need to be manually entered. As explained above, the cells that require manual information have a reminder either in the formula such as with the historic wins and historic losses or in plain text such as the accumulated historic trades and historic average RR.
You do not need to use the historic calculators for the rest of the sheet to work, but I think having this information might be useful in the long term.
Below these calculators, we can see the continuation of the general table. Remember, the pink columns have formulas that need to be expanded one at a time after the corresponding trade is finished. Expanding the formulas to the bottom of the table with no trades will confuse the calculators.
To the right, there is the personal feedback using a traffic light system to quickly identify what you did right or wrong.
Each column has a modifiable predefined list with several options, and each of these options has a corresponding cell color. I think taking a look at the screenshot below is a sufficient explanation of how it works. This is only for self-analysis and improvement, there are no numbers involved in this table.
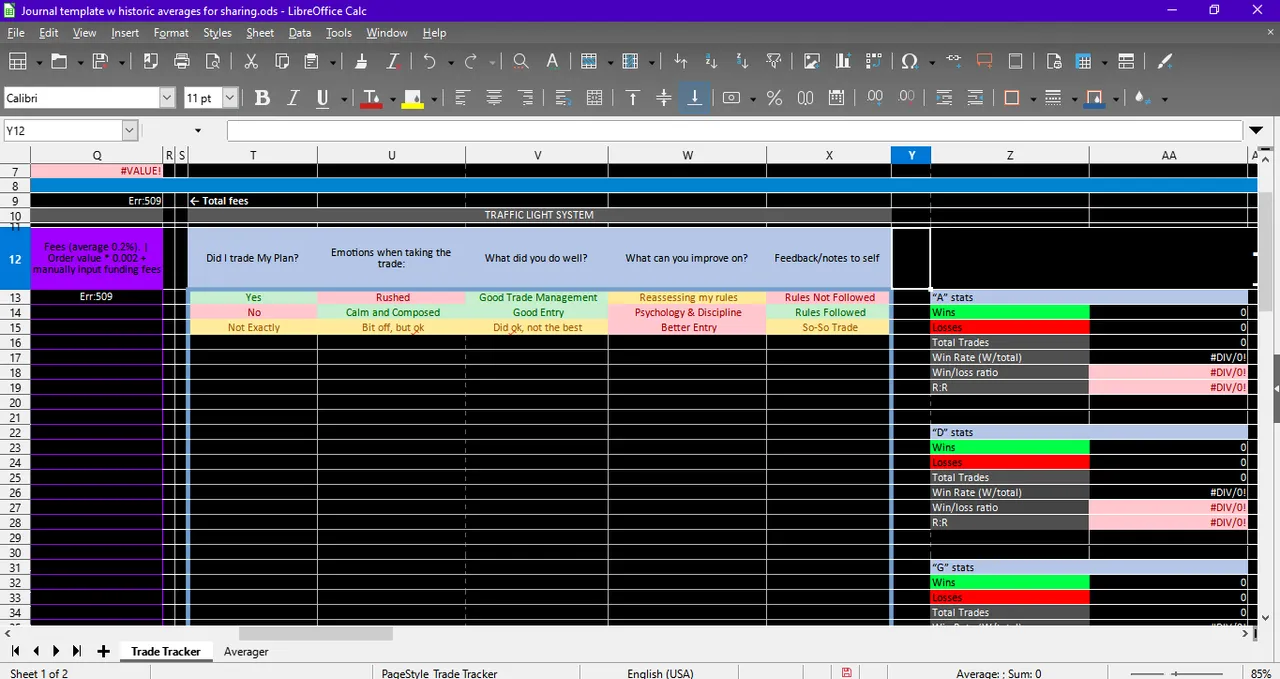
To the right, we will find the calculators per strategy. It works the same way as the general calculators, but these ones filter the results PER strategy. No manual input is required for them to work, except having the general table and the averager sheet with the trade's data.
Remember, when modifying the strategy names I included as an example in the form of letters, each of these calculators formulas will need to be modified with the correct strategy name. An easy way to do this is to use the find and replace option.
And as mentioned above, you also need to modify the predefined list in the strategy column in the general table by selecting the cells of that column and going to Data-Validity.
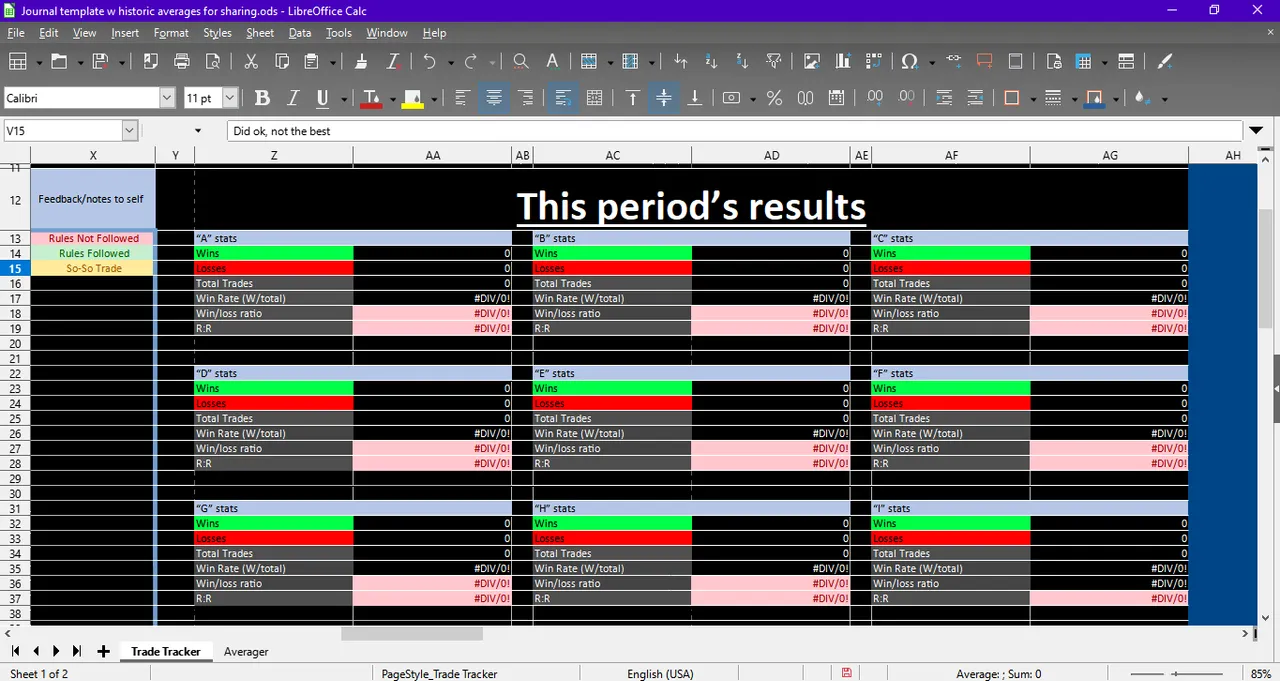
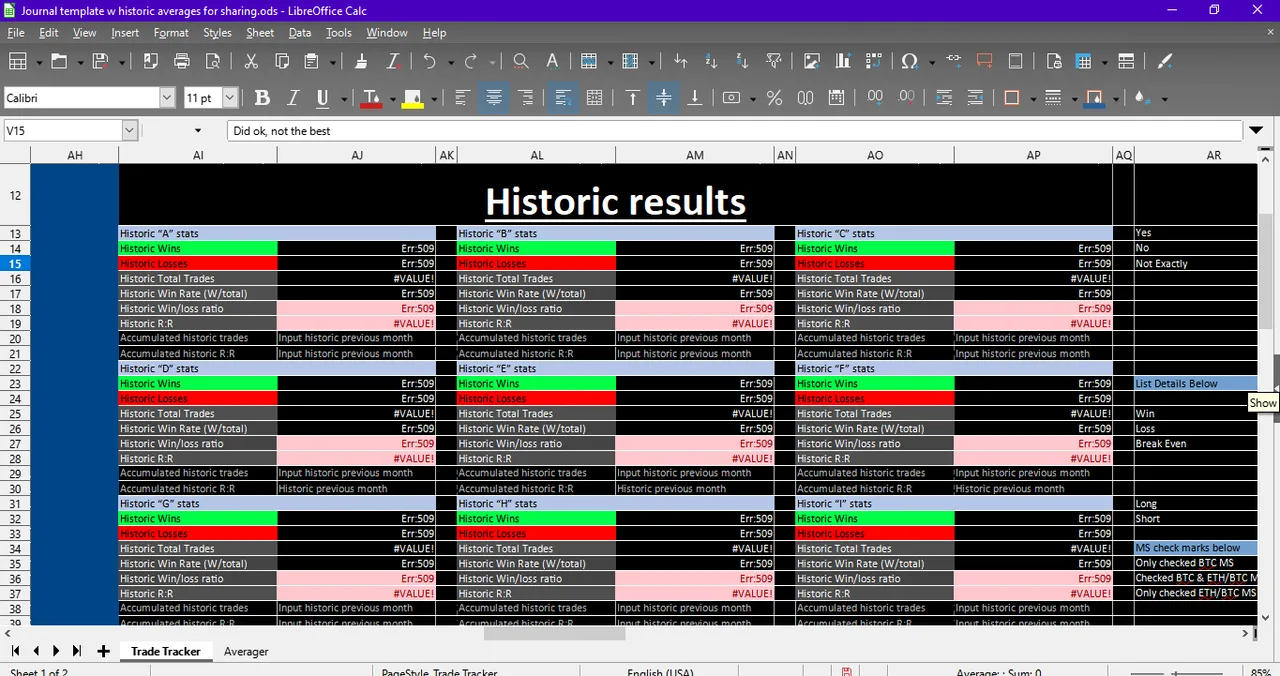
To the right, is the historic calculators per strategy. Just like the historic general calculator, each of these ones requires 4 numbers from the previous period that need to be entered manually. I will mention them again:
Accumulated historic wins from the previous period
Accumulated historic losses from the previous period
Accumulated total trades from the previous period
Average historic RR from the previous period.
Just like the general calculators, the cells have a small reminder about the requiring info that needs to be entered manually.
The texts to the right of these historic calculators per strategy has no use, however, the original template had some links between part of those texts and some of the original predefined lists, so I decided not to delete them in order to no screw anything. Either way, they don't disturb.
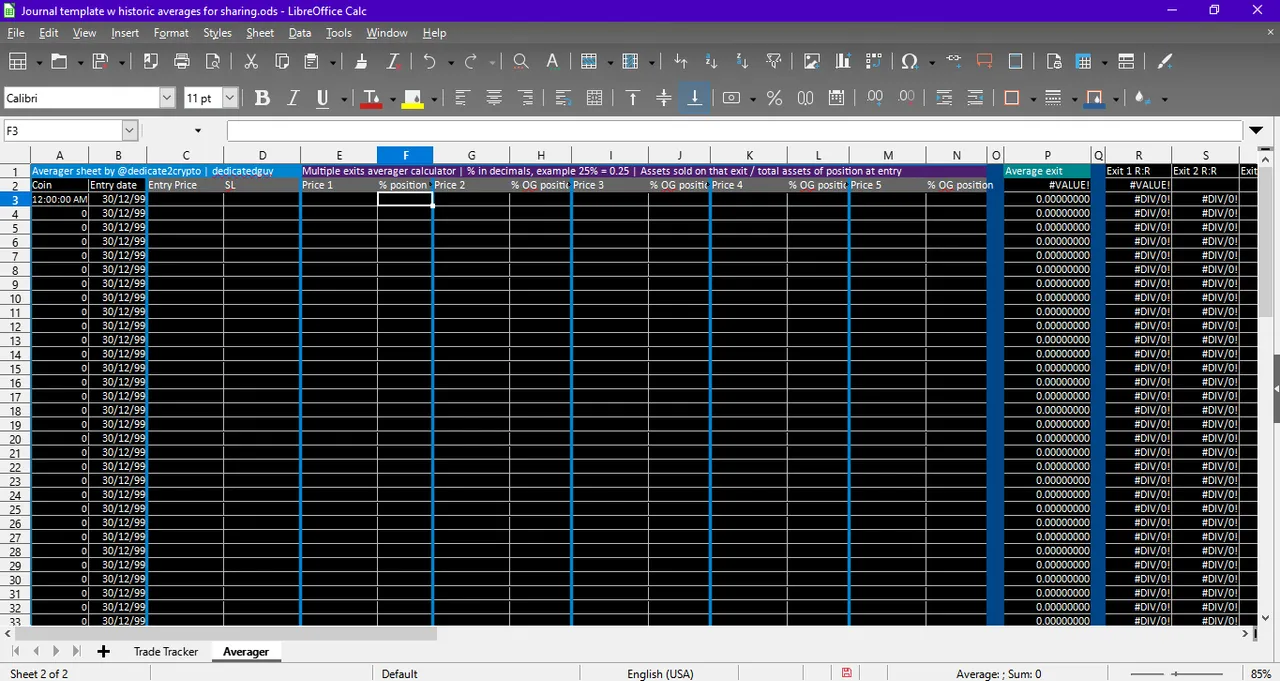
The second sheet of the journal is the averager, and it is useful when a trade has multiple exits, and therefore, different RRs per exit.
You need to fill the columns Entry, SL, Price, and % of sale in decimal form.
As mentioned at the top of the sheet, with multiple exits use the % in decimal form that you are selling in relation to the original position. For example.
Original position is 100 coins
The first sale was 50 coins, you input 0.5 under "% position"
The Second sale was 25 coins, you input 0.25 (not 0.5) under "% OG position".
The third and final sale was 25 coins, you input 0.25 once again. (not 1) under "% OG position" for the third exit and so on...
I also added an optional column at the end that calculates this %, just change "#coins" in the formula for your quantity and use the corresponding z cell.
The column "Full exit = 1" should always be = 1 when the trade is finished with no remaining portion. If it is more than 1 then re-check the %s in decimal form you are using. If it is less than 1, then you are still holding part of the position according to the information you have registered in this sheet.
The profit/loss in fiat money is calculated in 2 of the final columns with 2 different formulas for confirmation. In case you want to test both formulas, make sure the info like risk, position size, etc, is related to each other like a real trade. With imaginary unrelated data, the results will be different.
In this sheet, formulas can be copied to the entire column. There is no need to go 1 by 1 like in some cases of the Trade Tracker sheet.
That's all for today. I hope you found this information valuable and if you have questions about the journal then simply let me know about them so I can clear them up.
Thanks for reading!