The market wanted to go down. Japan wanted to go up. Week turned into some averaging down on the way down and profit taking and replacement buys in Japan.

Portfolio News
In a week where S&P 500 dropped 1.69% with 4 losing days in a row - closed Monday, my pension portfolio dropped a more modest 1.47%. Big value driver of the drop was De Grey Mining (DEG.AX) down 10% and marijuana stocks.

The market just did not want to go up this week. Friday open was the only time there was a sign of upward momentum based on the jobs report - more jobs than workers - but the steam ran out within 30 minutes of the open.
Saving grace in my portfolio was a a nice move up in Japan stocks up 2.5% on the week.
Big movers of the week were Yooma Wellness (YOOM.CN) (+30%), Northern Dynasty Minerals (NAK) (+23.4%), Cobalt Blue (COB.AX) (+18.2%), Cameco Corp (CCJ) (+13.2%), Direxxion Real Estate Bear ETF (DRV) (+12.3%), Gemfields (GEM.L) (+11.9%), Big Star Energy (BNL.AX) (+11.8%), Weatherford International (WFRD) (+10.4%), Kairos Minerals (KAI.AX) (+10.3%),SBI Holdings (8473.T) (+10.1%), Global X Uranium (URA) (+10.1%)
Hard to pick themes for the week other than a surge in uranium. The rise of the Real Estate Bear ETF (DRV) is worth paying attention to - maybe there are signs of interest rates rising in there.
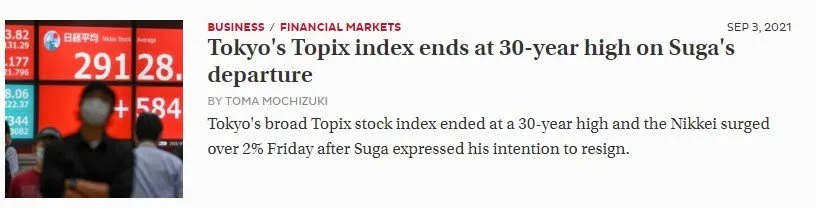
Japan Bounces
The resignation last week of Japan PM Yoshihide Suga has opened up an election process which promises to bring some stimulus into the Japan economy.

Good news for me as I am already invested in Japan. A 30 year high is hard to believe- I have been invested for a while and it does not feel like even a 3 year high.
This article in FT.com tells the story
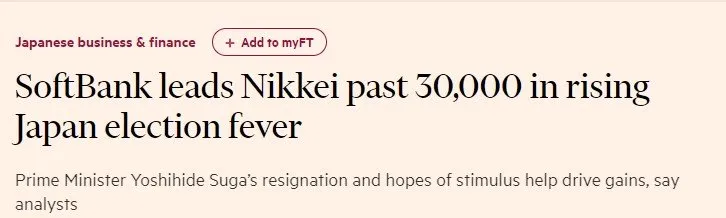
https://www.ft.com/content/96884c0a-b4e7-488a-8b91-5e033da15cb0
Crypto booms
Bitcoin price pushed higher 6.4% to start the week ahead of the El Salvador legal tender begin and then fell over finishing 9% lower than the open.
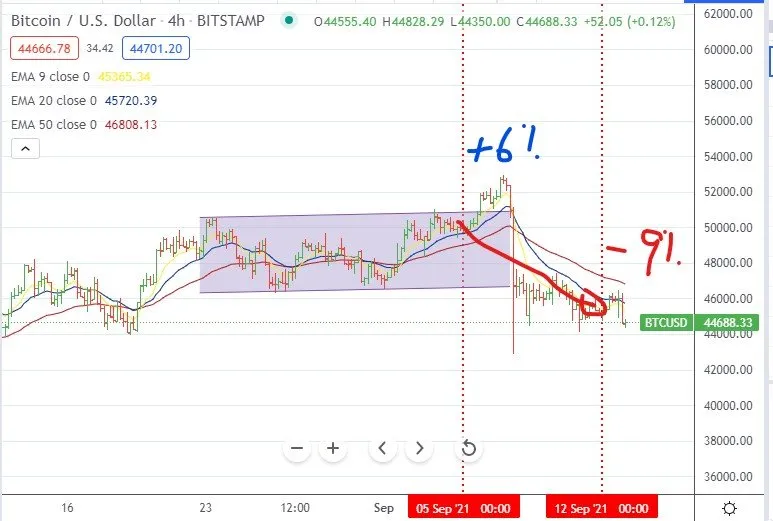
Most of the drop was presaged in one 4 hour candle on September 7 - feels like the big boys tried to shake the confidence of the market for the El Salvador rollout.

In those headlines is a Wall Street Journal opinion piece about this being a Bitcoin scam - I read the article. It is a typical media headline - the article is actually abut the de-dollarization of El Salvador - now this could be turned into a scam or it could just fail (Like Argentina) or it might even work.
All the crypto coins show the same massive co-ordinated selloff in the 4 hour bar starting September 7 at 8:00 am. Not all the coins in my portfolio ended the week down
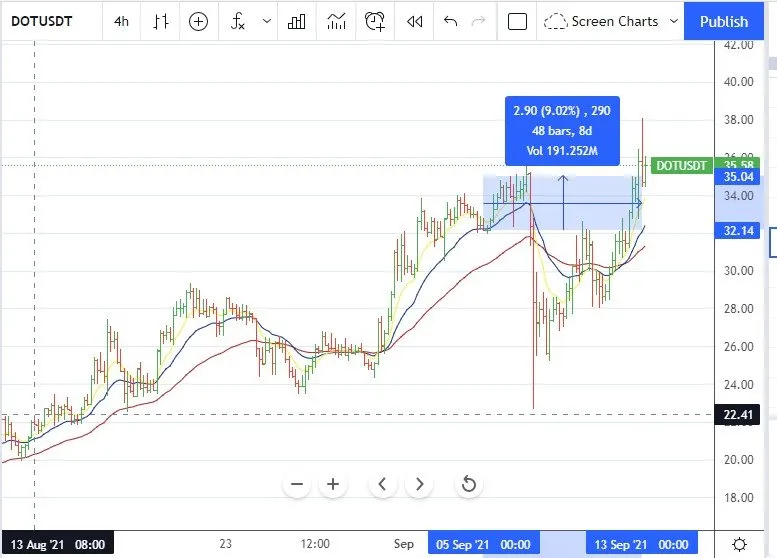
Polkadot finhsed up 9% on the week - and up 21% relative to Bitcoin.
Bought
Mission Produce, Inc (AVO): Farm Products. Averaged down entry price on a down day. Stock was up on the week.
Bed Bath & Beyond Inc (BBBY): US Retail. Averaged down entry price on a down day. Stock went down some more on the week.
ETFMG Prime Cyber Security ETF (HACK): Cybersecurity. Price has been trading above my covered call strike (65) - I bought a parcel of stock at 1% premium to likely assigned price. As it happens, price dropped below the covered call strike at the end of the week.
Taylor Morrison Home Corporation (TMHC): US Homebuilder. Since closing out my holding in US homebuilder, Lennar (LEN), I have been on the lookout out for ways to be invested. I read an article in Barron's suggesting this stock as a potential laggard. I did the price comparison charts from the March 2020 lows comparing TMHC and Lennar (LEN) and DR Horton (DHI) with SPDR US Homebuilders ETF (XHB). TMHC was outperforming and zoomed ahead until Q2, 2021 and then it came closer in, in price performance. The clues come when I did the comparison from October 2020 which was one of the lows for the Homebuilders ETF. It is important to choose these price comparisons from a high point or a low point rather than an arbitrary date.
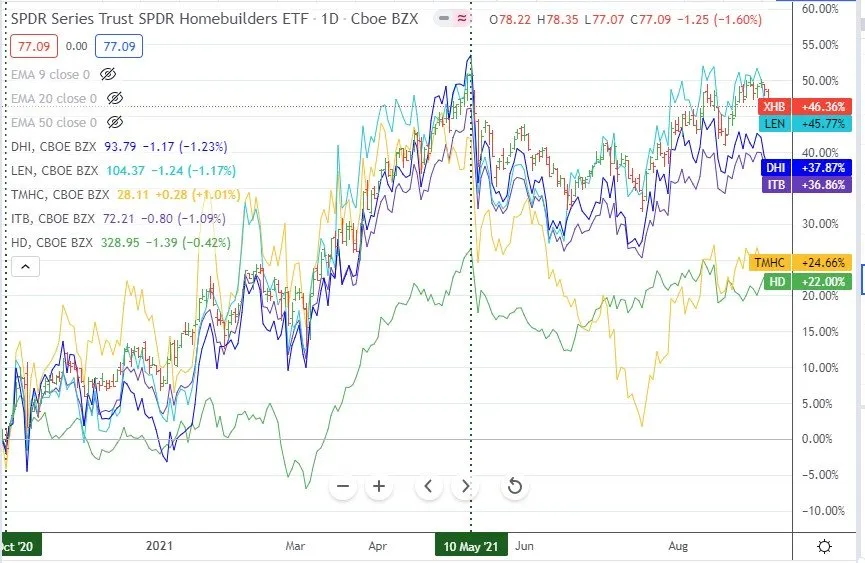
The chart shows the homebuilders ETF (XHB) as the bars. This shows that since October 2020, the ETF has outperformed the other stocks and the closest in was Lennar (LEN - light blue line). TMHC (yellow line) has lagged and is almost only half the performance of the ETF and quite a few percentage points behind the two big payers.
There is an anomaly in the ETF holdings - it is not only homebuilders as it also includes a lot of suppliers to the industry like air conditioning and beds and flooring and control equipment. It is these components of the ETF that have been outperforming. So the best comparator for TMHC is either Lennar or DR Horton or one of the other big builders. There is an iShares Home Construction ETF (ITB - purple line) which is a little more focused on builders - it too is lagging XHB
The Barrons article view was that TMHC is lagging because it has been growing through acquisition and has not really honed in on the integration benefits and the tight management practices like its main competitors have. However, management guidance is that they have set profit margins as a priority and with scarce supply expectations, there is a chance that average revenue per house will also rise.
I bought a small parcel of stock against which I wrote October expiry covered call at 2.1% premium with 6% coverage.
The Home Depot, Inc (HD): US Retail. I did watch a CNBC segment on the weekend about the homebuilders and about the constituents of the XHB ETF. One view was that the easy buy was Home Depot - the chart above shows that it too is lagging. I increased the size of my holding in one portfolio.
Wells Fargo & Company (WFC): US Bank. I watched a CNBC segment on US Banks on the weekend - the two analysts were leaning to options trades and small nibbles on JP Morgan and Morgan Stanley. I looked at options chains and went on a path I was already on - I added a small parcel of Wells Fargo - Jim Cramer added back in last week's selloff - this is a continuation of that. I wrote a covered call for October expiry for 1.9% premium with 6% price coverage. I also wrote an October naked put for 1.2% premium with 11.9% coverage.
Japan
Following the sale of two Japanese stocks over the last few days, I ran stock screens to identify replacements. I was keen to replace with stocks that had good Japan domestic exposure. Screens I used were Price to Sales (<2), Price to Book (<1.0) and Price Earnings (<15) with stocks making 20 day highs.
PLANT Co.,Ltd (7646.T): Japan Retail. Came out on PE and PB (0.38) and PS (0.06) screens. Dividend yield 3.5%.
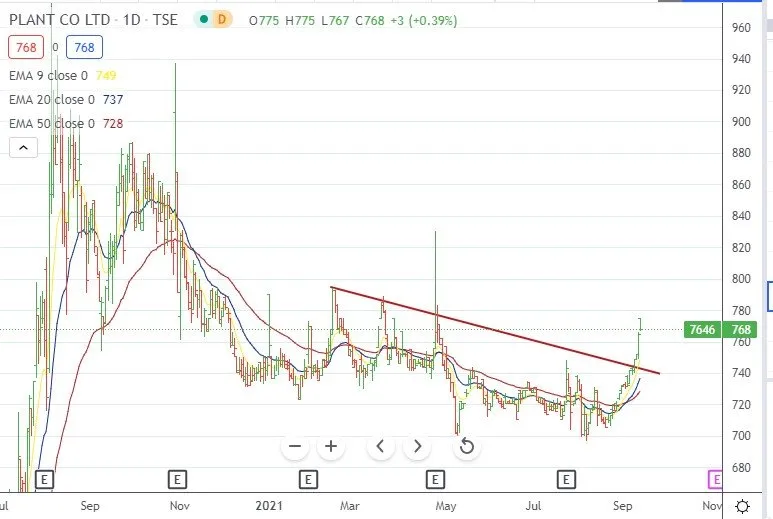
Chart shows price has been making a series of lower highs for all of 2021 and has now broken upwards.
Kamei Corporation (8037.T): Japan Industrial. Came out on PE screen. Dividend yield 2.36%
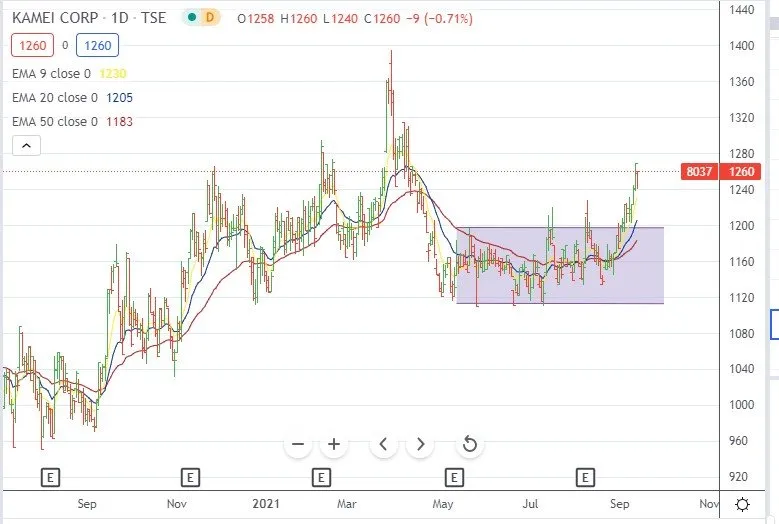
The chart shows price has been in a trading range for the last two quarters and has now broken out above that range
**Kato Sangyo Co., Ltd. (9869.T): Japan Food Products. Came out on PB (0.93), PE and PS (0.11) screens. Dividend yield 2.1%
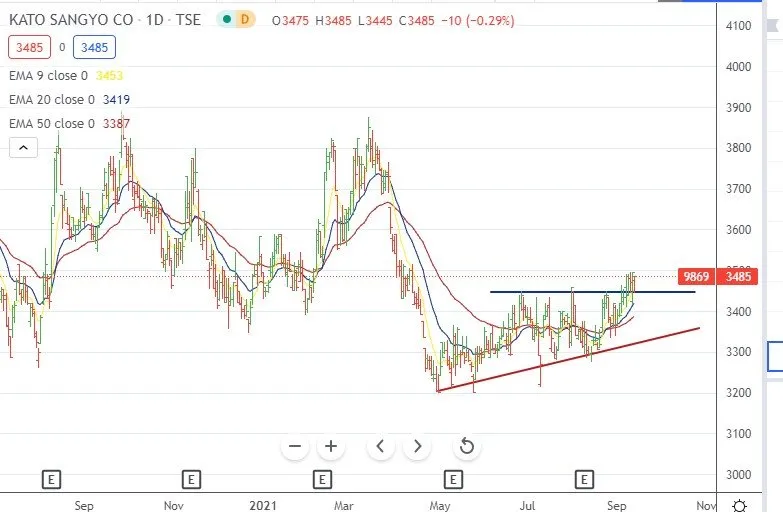
Chart shows price has been creating a series of higher lows with level highs - those highs have now been broken
AbbVie Inc (ABBV): US Pharmaceuticals. Added a small parcel following a Jim Cramer idea to add after the selloff following FDA guidelines on packaging warnings for the Rinvoq eczema treatment. The view is the market over reacted and does not fully appreciate the value of AbbVie's product portfolio (not only Rinvoq). Also wrote an October expiry naked put for 1.63% premium with 4.3% price coverage.
Sold
JK Holdings Co., Ltd (9896.T): Japan Building Products. Profit taking pending order hit at 52 week high for 32% profit since November 2019. The initial trade idea was based on a stock screen search and I chose this stock as its fortunes are more tied to the Japanese domestic economy.
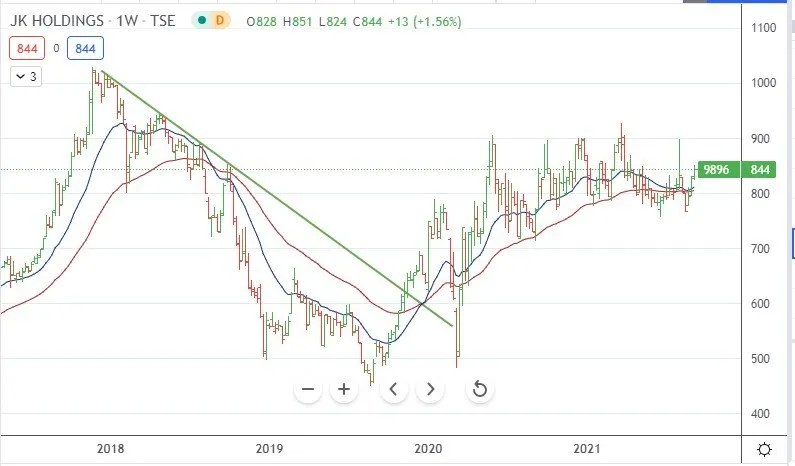
The updated chart shows the entry point was made after the downtrend was broken. That trendline was tested again with the covid collapse and has recovered. Price is now in a trading range and the 20 day moving average (blue line) has just crossed below the 50 (red line). Feels like it was an opportune exit.
See TIB488 for the original trade rationale
VanEck Vectors Russia Small-Cap ETF (RSXJ): Russia Small-Cap Index. Closed out at 52 week high for 5.74% blended profit since August 2017/May 2018. Been waiting for this to get to breakeven to close it out. The initial trade thesis was on the back of rising oil prices pushing Russia base economy up - well that did not work out that way with first US shale share boom and then covid trashing oil prices.
Cryptocurrency
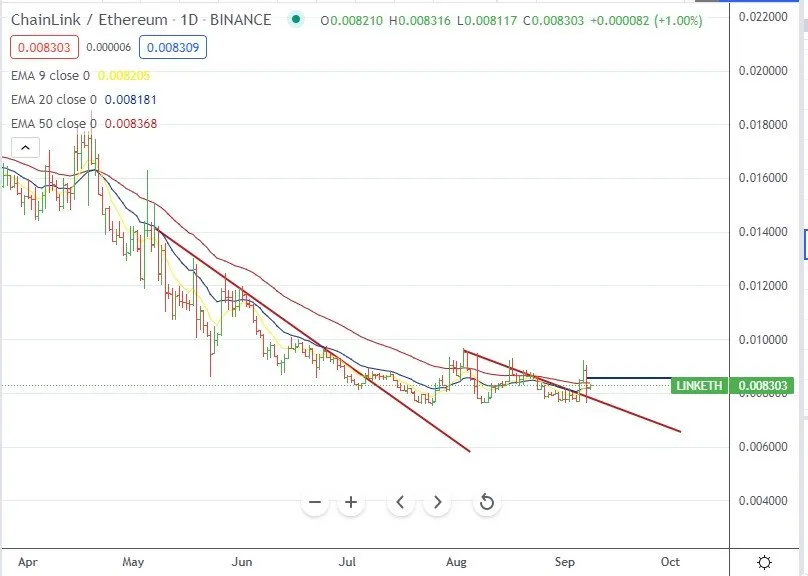
Chainlink (LINKETH). I noticed the break of the downtrend of LINK vs Ether - bought a small parcel to round up holdings to match other holdings.
Income Trades
Between the three portfolios, I wrote 6 covered calls (US 5, Europe 1) and 4 naked puts (all US)
I did write about setting up naked puts on some US banking stocks. These are all stocks I am happy to own at lower entry levels.
Wells Fargo & Company (WFC) Sept expiry 40 strike premium 1.2% coverage 11%
JP Morgan Chase & Co. (JPM) Oct expiry 150 strike premium 1.35% coverage 6%
Citigroup Inc. (C) Nov expiry 60 strike premium 1.22% coverage 18%
Currency Trades
Australian Dollar (AUDNZD): Followed trade signal (180H4 and IR) on Thursday (Sept 9) to go short AUD vs NZD. New Zealand Dollar has been showing a lot of strength. The trade was triggered before Friday cutoff and held over the weekend
Cautions: This is not financial advice. You need to consider your own financial position and take your own advice before you follow any of my ideas
Images: I own the rights to use and edit the Buy Sell image. News headlines come from Google Search. All other images are created using my various trading and charting platforms. They are all my own work
Tickers: I monitor my portfolios using Yahoo Finance. The ticker symbols used are Yahoo Finance tickers. Crypto tickers come from TradingView
Charts: http://mymark.mx/TradingView - this is a free charting package. I have a Pro subscription to get access to real time forex prices
Bitcoin: Get started with mining Bitcoin http://mymark.mx/Galaxy
Trading: Binance offers a wide range of coins to trade, tight spreads and low fees if you use BNB to pay https://mymark.mx/Binance
Tracking: Keeping track of your crypto trades is a whole lot easier with CoinTracking.info. Get 10% off all your account upgrades https://mymark.mx/CoinTracking
September 6-10, 2021