Hello dear Hivers,
here are the:
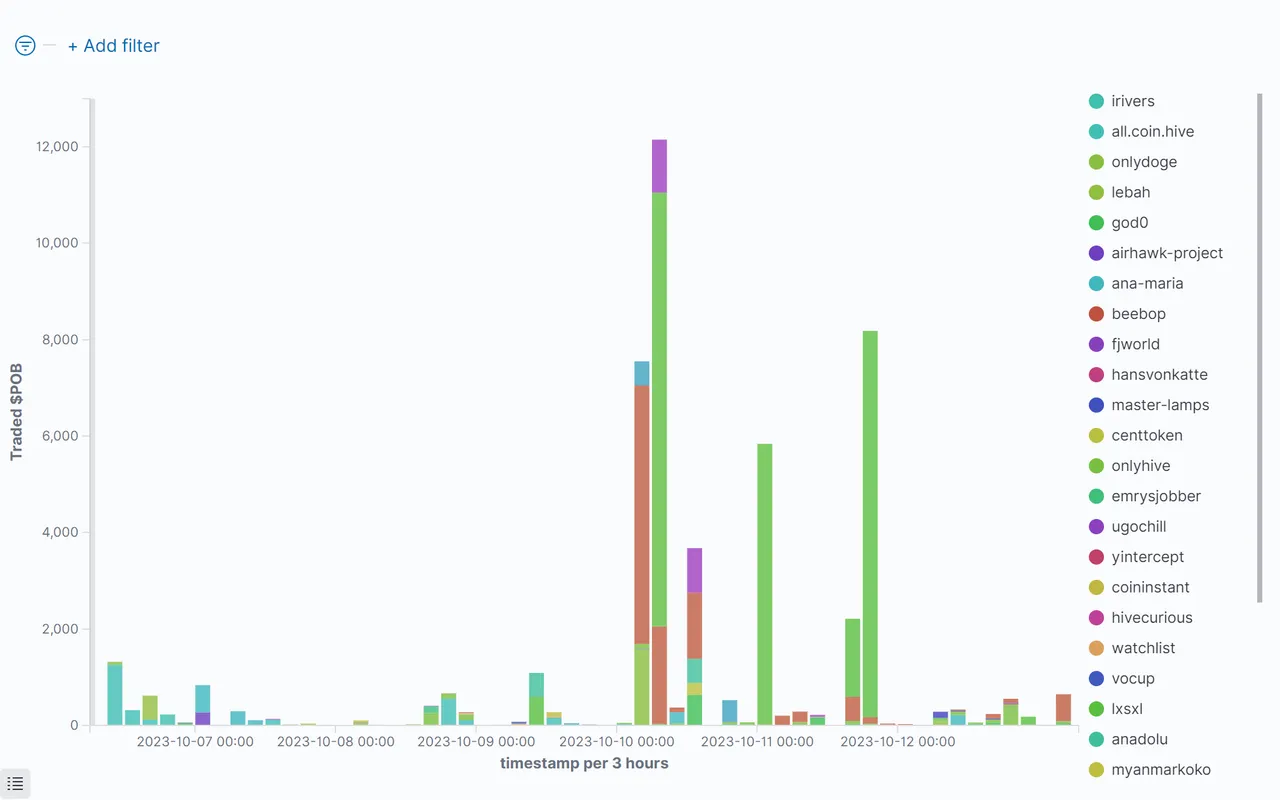
$POB Statistics For The Last 7 Days, 2023-10-06 to 2023-10-13:
Who has bought how many $POB at which time:
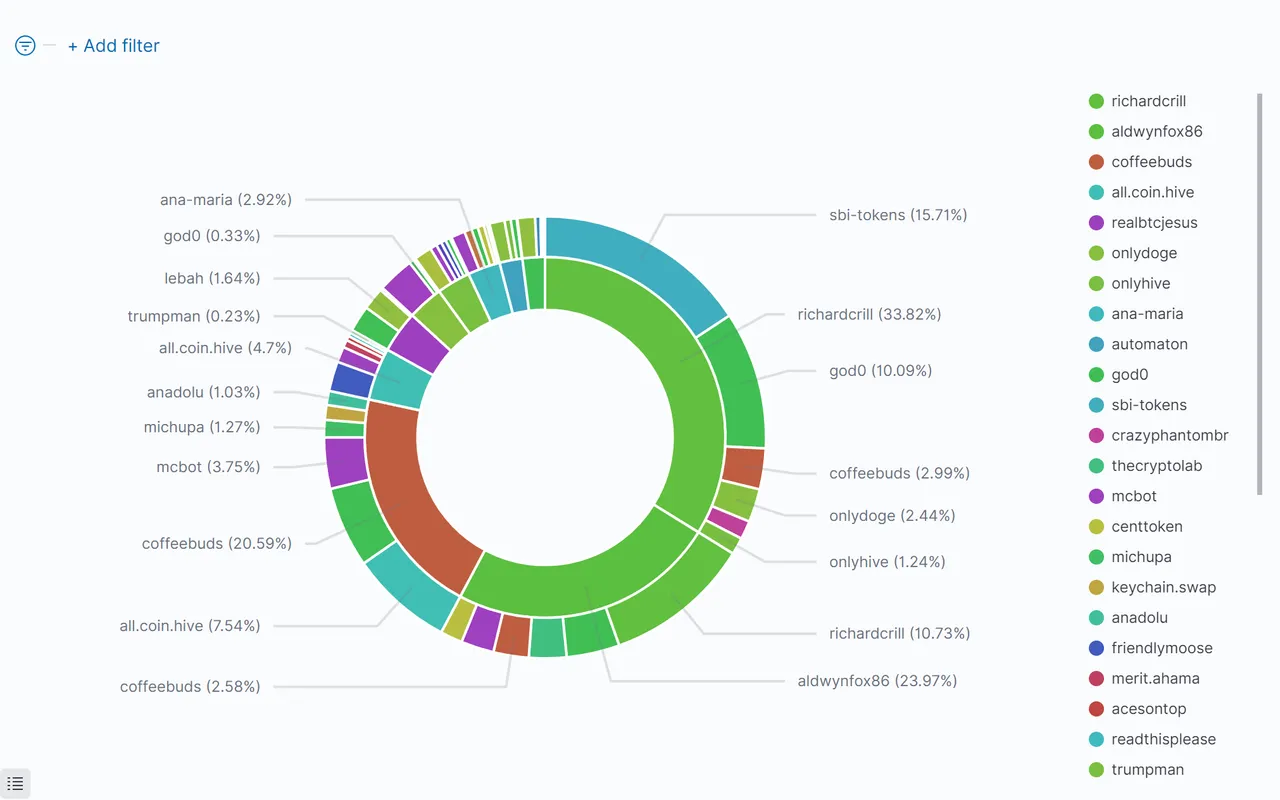
Top $POB Buyers And $HIVE Sellers
The inside of the circle shows the buyers of $POB, ordered by $HIVE they have spent. The outside shows the recipients of that $HIVE (sellers of $POB):
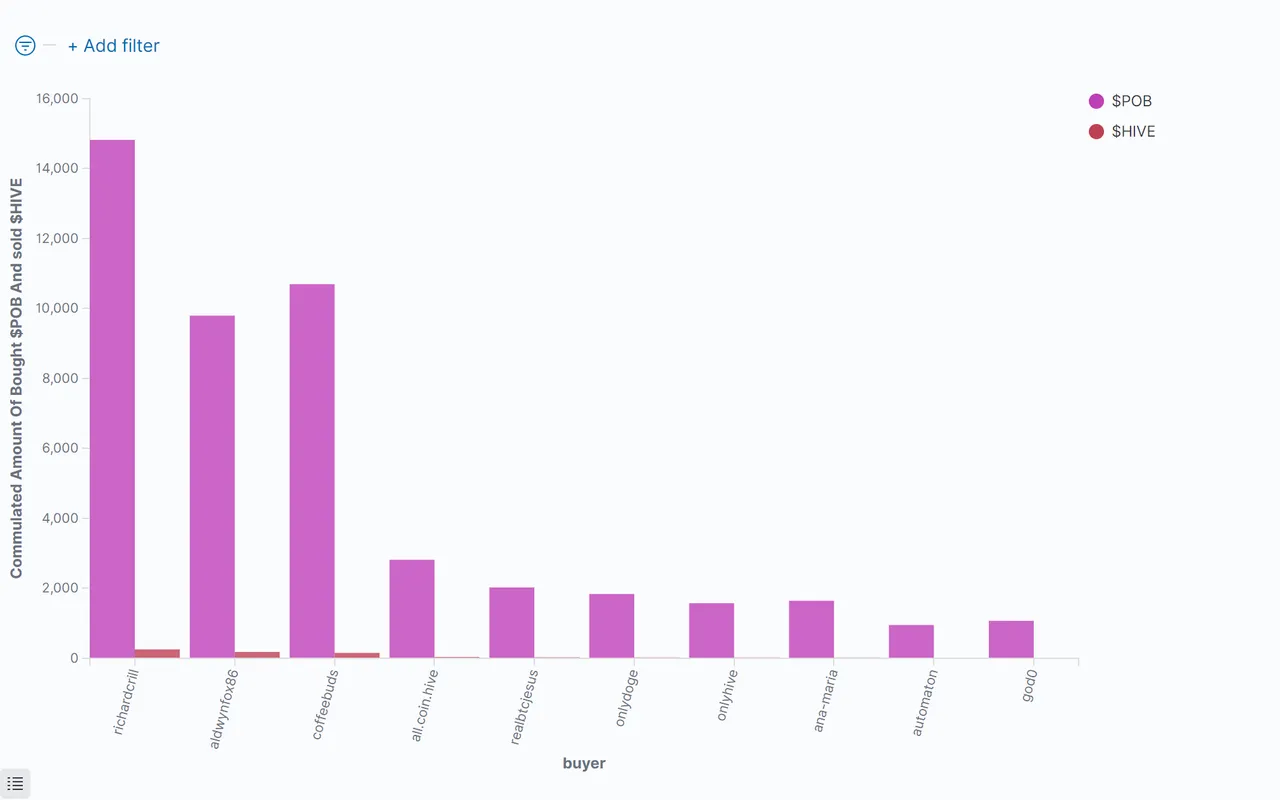
Commulated Amount Of Bought $POB Per Person
Top 10 $POB buyers, how much they got and how much $HIVE they spend for this. Sorted by $HIVE, that was spent:
Top 20 $POB Buyers
Sorted by the $HIVE, they have spent:
| Buyer(Descending) | Sold $HIVE | % Sold $HIVE | Bought $POB | Avg. Price | Number of Trades |
|---|---|---|---|---|---|
| @richardcrill | 253.61786 | 31.67 % | 14822.06735 | 0.01703 | 30 |
| @aldwynfox86 | 179.74755 | 22.44 % | 9797.50670 | 0.01811 | 38 |
| @coffeebuds | 154.39306 | 19.28 % | 10695.07776 | 0.01479 | 61 |
| @all.coin.hive | 35.23455 | 4.40 % | 2815.64221 | 0.01257 | 42 |
| @realbtcjesus | 28.14618 | 3.51 % | 2025.27674 | 0.01412 | 4 |
| @onlydoge | 23.89767 | 2.98 % | 1838.46129 | 0.01447 | 8 |
| @onlyhive | 22.59965 | 2.82 % | 1574.89388 | 0.01467 | 149 |
| @ana-maria | 21.86147 | 2.73 % | 1643.70684 | 0.01336 | 16 |
| @automaton | 15.34553 | 1.92 % | 949.99999 | 0.01582 | 12 |
| @god0 | 15.05154 | 1.88 % | 1071.42101 | 0.01409 | 41 |
| @anadolu | 13.51931 | 1.69 % | 996.87035 | 0.01337 | 3 |
| @lxsxl | 9.15853 | 1.14 % | 637.42789 | 0.01743 | 9 |
| @lebah | 7.92758 | 0.99 % | 616.46655 | 0.01238 | 19 |
| @centtoken | 4.04976 | 0.51 % | 284.53327 | 0.01377 | 6 |
| @airhawk-project | 3.49196 | 0.44 % | 279.00000 | 0.01252 | 6 |
| @idoodle | 3.26876 | 0.41 % | 204.79652 | 0.01494 | 32 |
| @hansvonkatte | 1.83259 | 0.23 % | 132.42876 | 0.01298 | 3 |
| @emrysjobber | 1.80000 | 0.22 % | 138.46555 | 0.01300 | 2 |
| @myanmarkoko | 1.50000 | 0.19 % | 107.15817 | 0.01400 | 2 |
| @fjworld | 0.62700 | 0.08 % | 50.00000 | 0.01260 | 8 |
| others | 3.81975 | 0.48 % | 272.45072 | 0.01524 | 43 |
| Sum: | 800.89030 | 100 % | 50953.65155 | 0.01461 | 534 |
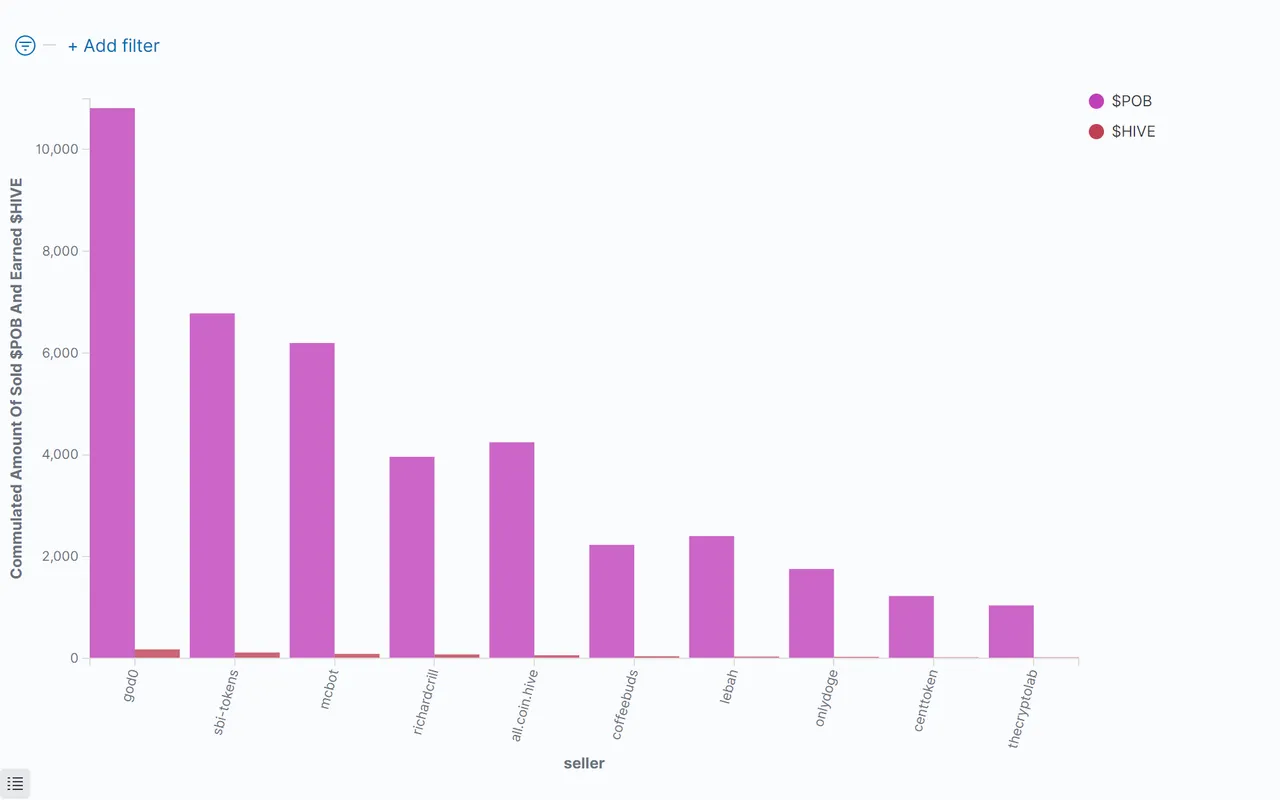
Commulated Amount Of Sold $POB Per Person
Top 10 $POB Sellers, how much they sold and how much $HIVE they got for this, sorted by $HIVE:
Top 20 $POB Sellers
Sorted by the $HIVE, they have got:
| Seller(Descending) | Earned $HIVE | % Earned $HIVE | Sold $POB | Avg. Price | Number of Trades |
|---|---|---|---|---|---|
| @god0 | 175.41963 | 21.90 % | 10813.83870 | 0.01561 | 54 |
| @sbi-tokens | 113.88586 | 14.22 % | 6778.91992 | 0.01680 | 1 |
| @mcbot | 86.29983 | 10.78 % | 6196.36186 | 0.01393 | 24 |
| @richardcrill | 75.24997 | 9.40 % | 3960.52466 | 0.01900 | 1 |
| @all.coin.hive | 59.45072 | 7.42 % | 4246.53662 | 0.01400 | 2 |
| @coffeebuds | 39.76813 | 4.97 % | 2229.44556 | 0.01737 | 3 |
| @lebah | 32.65994 | 4.08 % | 2402.47660 | 0.01379 | 11 |
| @onlydoge | 27.96457 | 3.49 % | 1754.79444 | 0.01592 | 8 |
| @centtoken | 19.58309 | 2.45 % | 1223.88037 | 0.01600 | 13 |
| @thecryptolab | 19.23054 | 2.40 % | 1039.48865 | 0.01850 | 1 |
| @friendlymoose | 16.02589 | 2.00 % | 1280.78900 | 0.01251 | 5 |
| @onlyhive | 13.69962 | 1.71 % | 795.03471 | 0.01693 | 19 |
| @crazyphantombr | 13.25089 | 1.65 % | 773.99057 | 0.01746 | 3 |
| @michupa | 9.54656 | 1.19 % | 599.71571 | 0.01589 | 3 |
| @keychain.swap | 7.60005 | 0.95 % | 500.00000 | 0.01520 | 2 |
| @anadolu | 7.00000 | 0.87 % | 500.00000 | 0.01400 | 1 |
| @mayvileros | 5.83715 | 0.73 % | 366.54336 | 0.01592 | 20 |
| @watchlist | 4.36079 | 0.54 % | 311.52965 | 0.01400 | 4 |
| @oceanbee | 4.33797 | 0.54 % | 333.68982 | 0.01300 | 3 |
| @hansvonkatte | 3.87553 | 0.48 % | 240.00124 | 0.01556 | 5 |
| others | 65.84359 | 8.22 % | 4606.09014 | 0.01433 | 351 |
| Sum: | 800.89032 | 100 % | 50953.65158 | 0.01448 | 534 |
Price Of The $POB
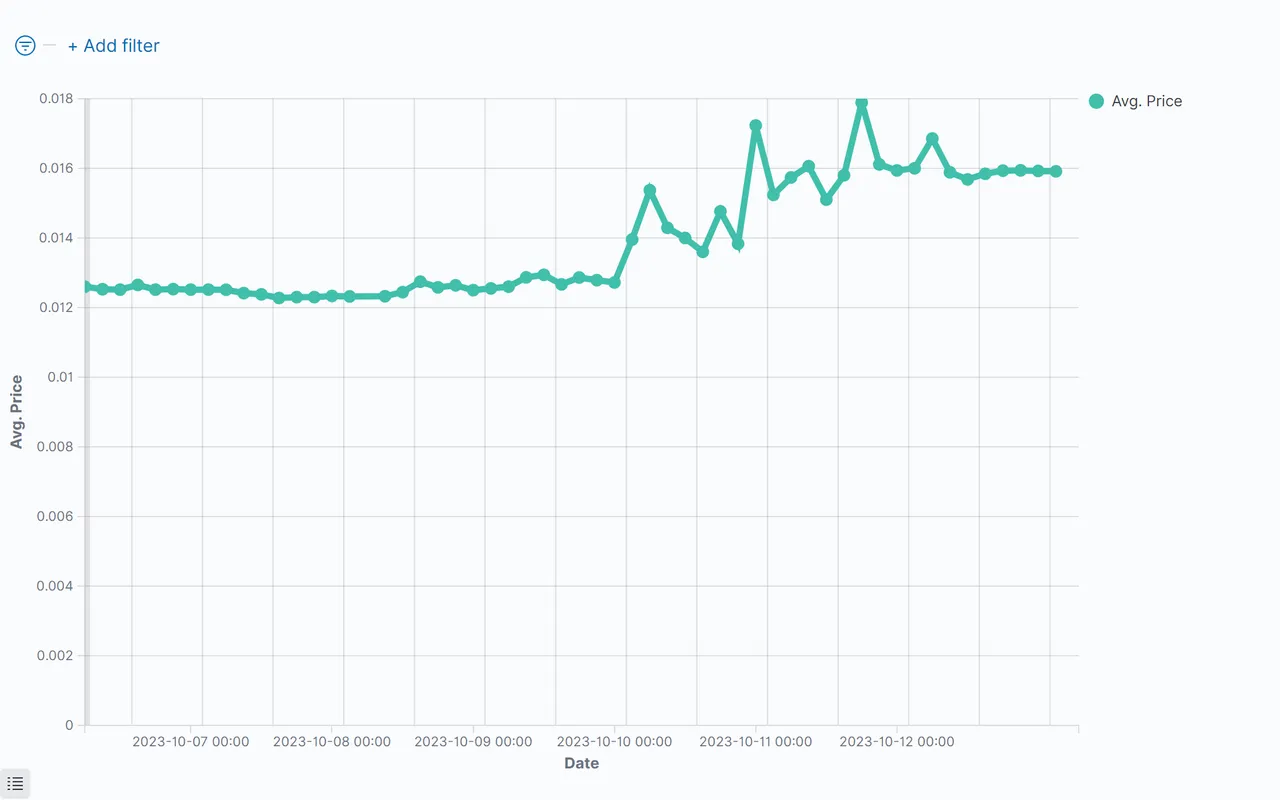
$POB Summarize Metrics
| Request | Received Hive | Received HIVE % | Sold $POB | Avg. Price |
|---|---|---|---|---|
| buy | 428.51855 | 53.51% | 25807.05280 | 0.01603 |
| sell | 372.37176 | 46.49% | 25146.59876 | 0.01411 |
| sum: | 800.89031 | 100% | 50953.65156 | 0.01507 |
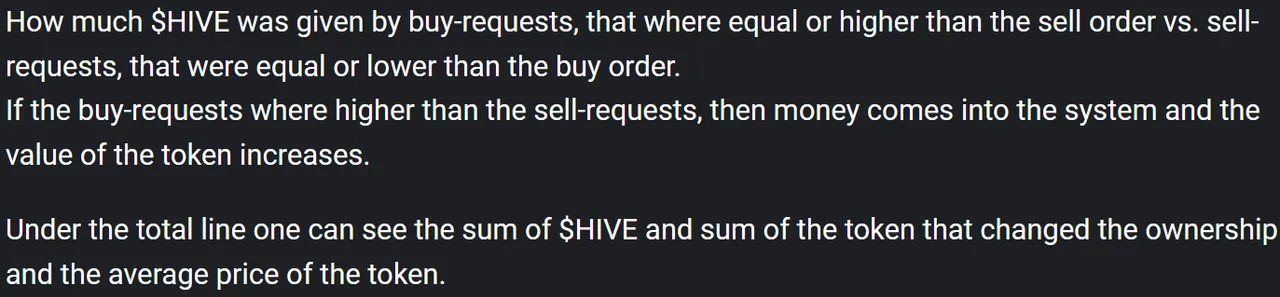
Comparison With Other Tokens
$HIVE/Token
This figure shows the value of $HIVE compared to some tokens. Be aware of the nonlinear (root square) y-axes.
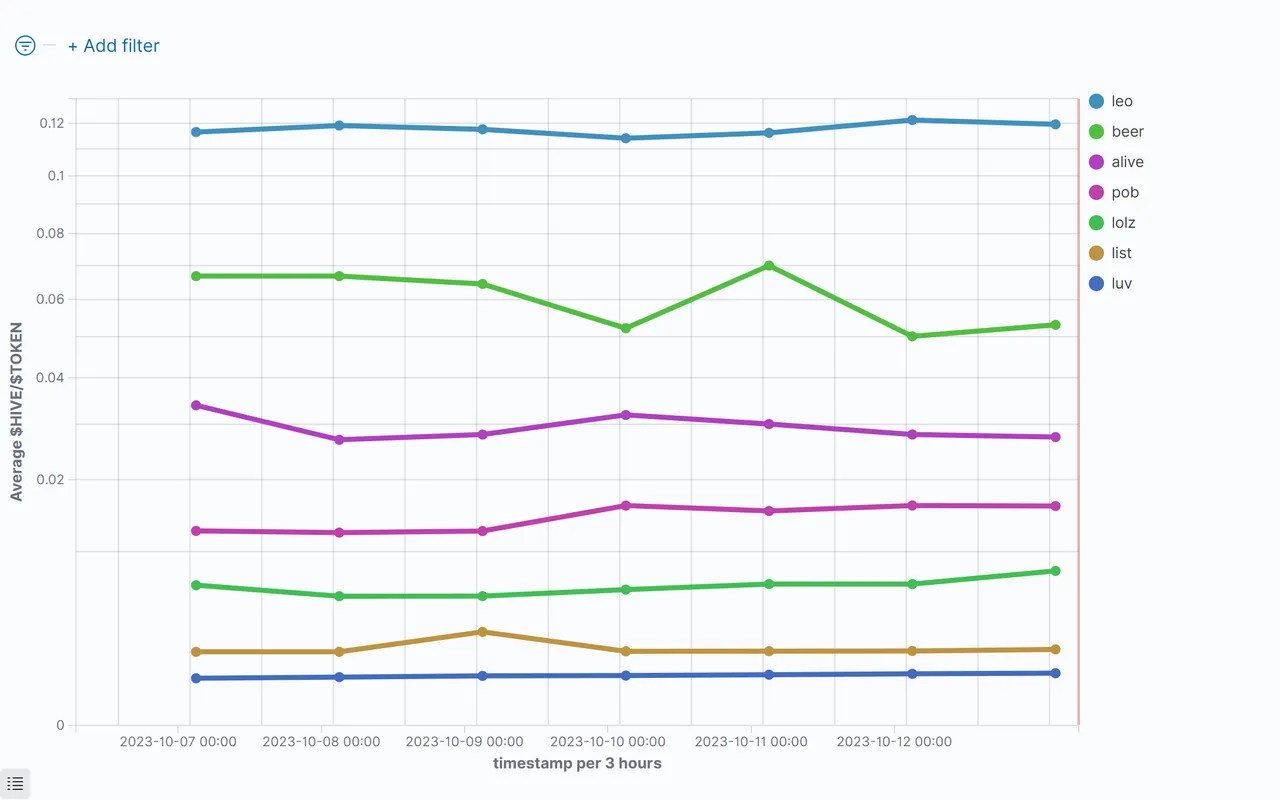
US-Dollar/Token
Value of $USD compared to some token. Be aware of the nonlinear (root square) y-axes.
HIVE Coinmarketcap rank: 159
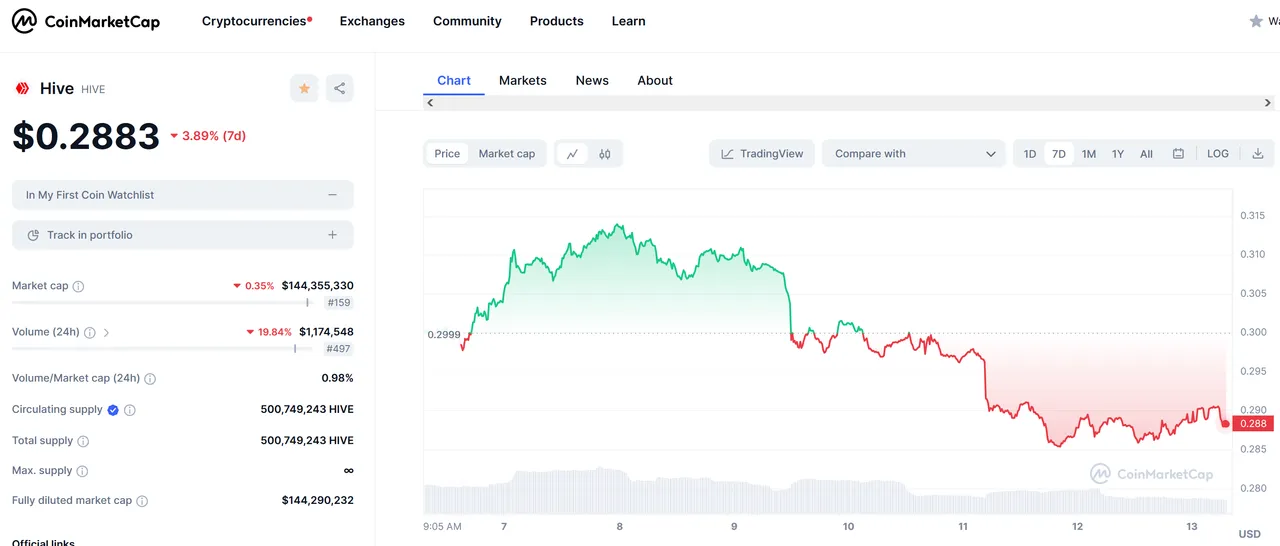
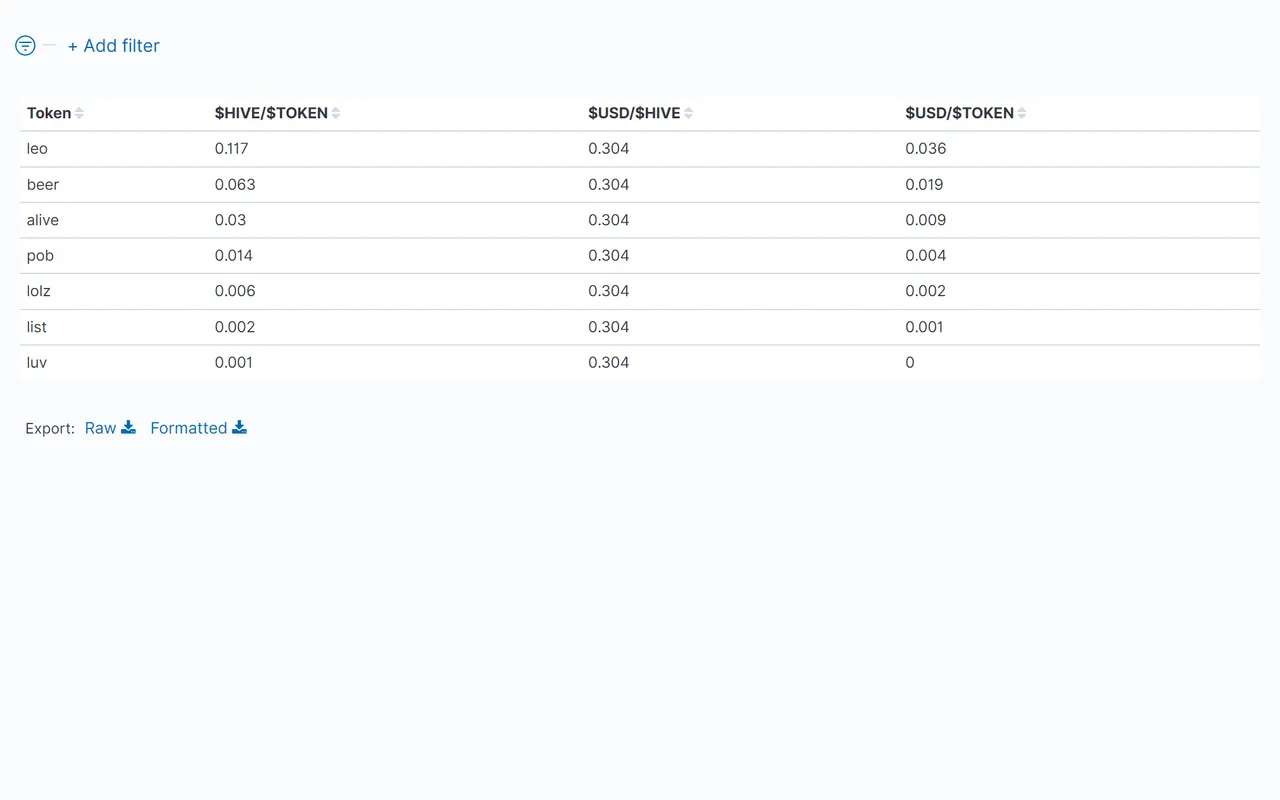
Table Of Token Prices in $HIVE and $USD
Average value of the prices of the token. Hive and US-Dollar compared to the token:
Links:
@achimmertens/posts?filter=stats
@anobel
https://github.com/achimmertens
Some More Words
I have worked on my tokenstats code last week. I have added the beerbot statistics. They are automated now also. And they are back. I have left them out in the last weeks, because they are manual work and I didn't had the time to do it. But for the future, they should appear regularly.
I have worked on the timeframe automation. Until now, it was static to 7 days. But when I leave one week out in my statistics, I want to have a 14 days statistics afterwards. This ment to me, that I had to do some manual work in the code. Now I have one place, where I just type in the number of days, for which I want to do the statistics.
I wish you a nice week,
Achim Mertens