tl;dr - The rate of B.1.1.7 in the US was below 0.5% in late December, we don't know how much below. That means we likely have until April or later before B.1.1.7 becomes dominant and infections accelerate.
This is a bit technical, but very cool and very reassuring.
Our PCR tests look for 3 specific COVID RNA segments. One of the mutations in B.1.1.7 deletes a pair of amino acids at positions 69 and 70, and through a major stroke of luck, that messes up one of those 3 RNA bits. (Bit of a needle in a haystack there, big lucky break.) That means that a positive COVID PCR test from B.1.1.7 and any other mutant missing 69/70 will only fire two of the three markers, and that pattern is known as an "S dropout".
In the UK, with B.1.1.7 everywhere, they can use that as a simple marker for the spread. This paper analyzes US results.
Note that B.1.1.7 will always cause and S dropout, but not all S dropouts are going to be B.1.1.7, because that's a mutation that has occurred independently as well. So the rate of S dropouts is the upper limit for B.1.1.7 spread; it could be lower than that and we don't know how much lower.
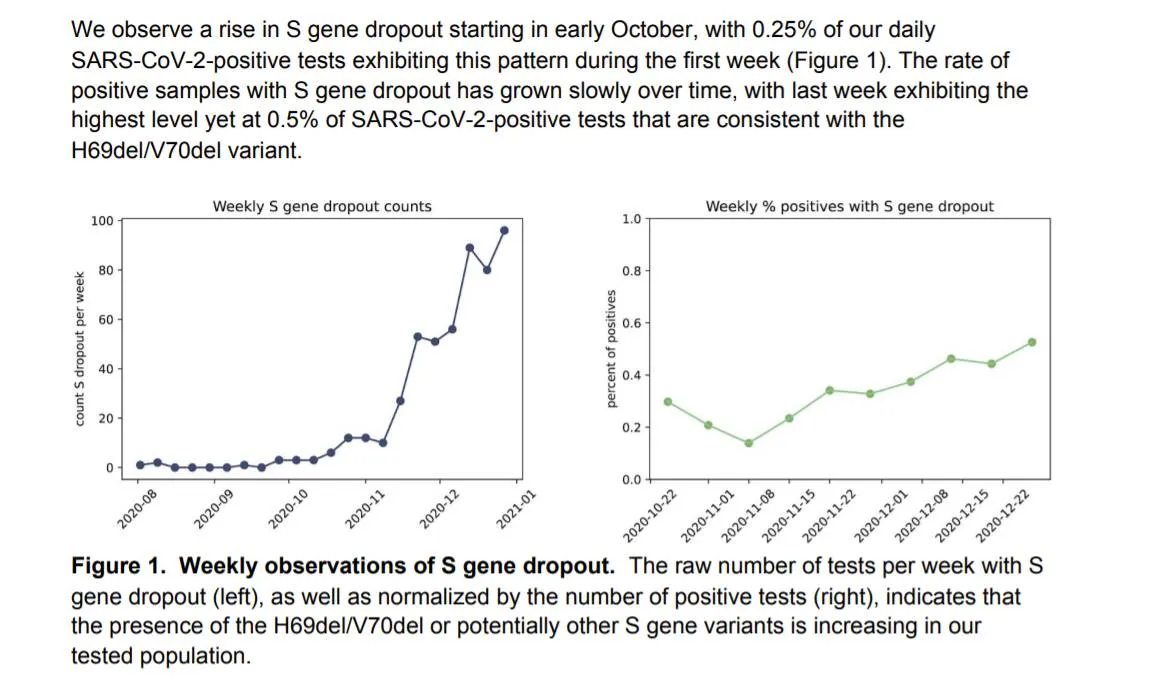
The left chart is raw numbers and covers a longer time span, ignore it for now. The right chart is what matters, it's S dropouts as a % of total positive tests.
In the UK's experience, B.1.1.7 increases its share about 6x monthly in the early phase, slowing only as it approaches dominance. Our late December S dropout percent was 0.5%, and that was only up from 0.2% two months earlier. That suggests to me that most of the October S dropouts weren't B.1.1.7, because the increase is slower...but most of the growth has been driven by a small B.1.1.7 presence growing at its 6x monthly rate. If that's correct, we're probably at 0.3 or 0.4% at the end of December.
That would put us on track for a ballpark estimate of 2.4% at end of January, 15% by the end of February, and becoming dominant around late March or early April, and pretty much totally in control by the start of May. That's good news, because it makes the nightmare case of being two months earlier very unlikely, and we should be able get ahead of it with vaccinations.
Remember that the lift in infections caused by 100% B.1.1.7 can be offset by getting 30% of the population vaccinated. That doesn't end the pandemic, we need herd immunity levels for that, but it would prevent the new strain from totally exploding our numbers.

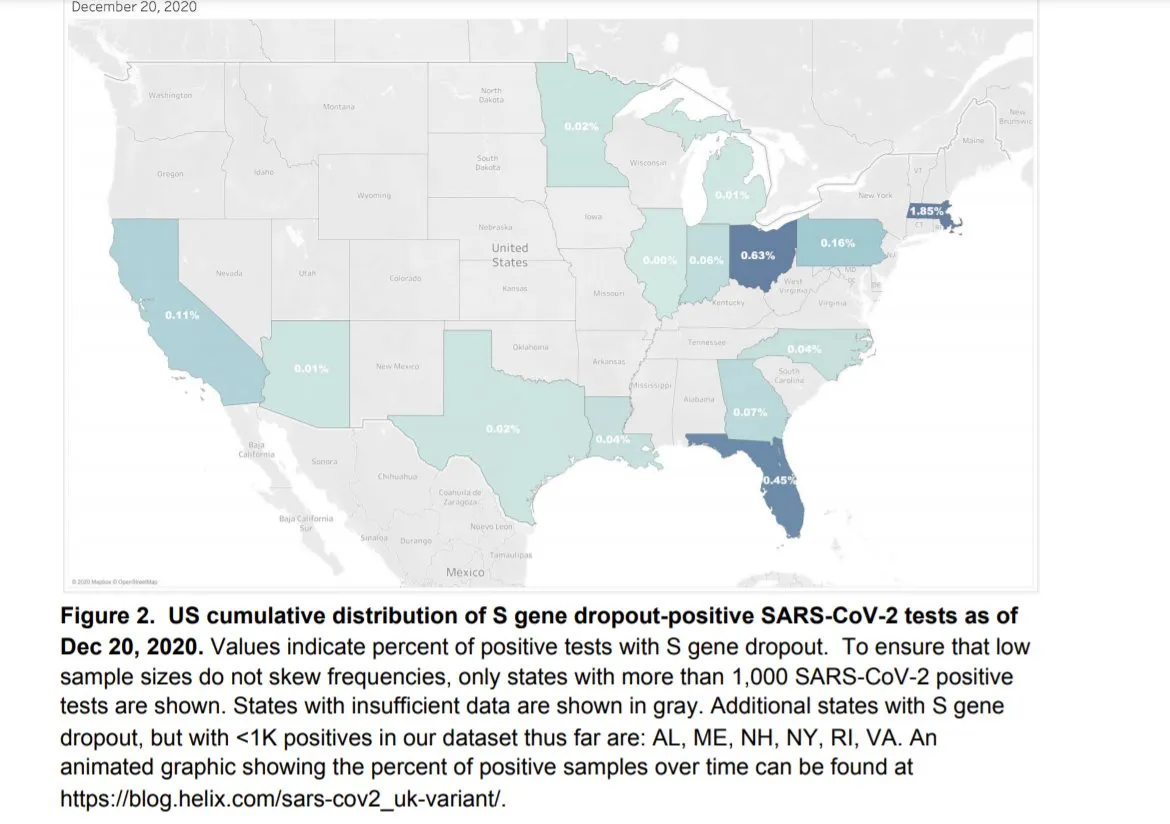
They also give a map of which states are showing elevated S dropout rates, my guess is this will largely show our pattern of where B.1.1.7 outbreaks really emerge. It's a decent bet that MA, OH or FL will be a month ahead of the rest of the US.
This is still somewhat speculative because S dropouts are not all B.1.1.7, and the timing and growth rate of B.1.1.7 isn't precisely known, but it's great to have some info and it's a relief that it doesn't look like worse news.