I've been trying to get a better understand of exactly what's driving the disparate outcomes between states, i.e. why are NY and NJ plummeting down 90% and still going, AZ, TX, FL and others are hitting new highs.
State by state usage stats for the OpenTable reservation app.
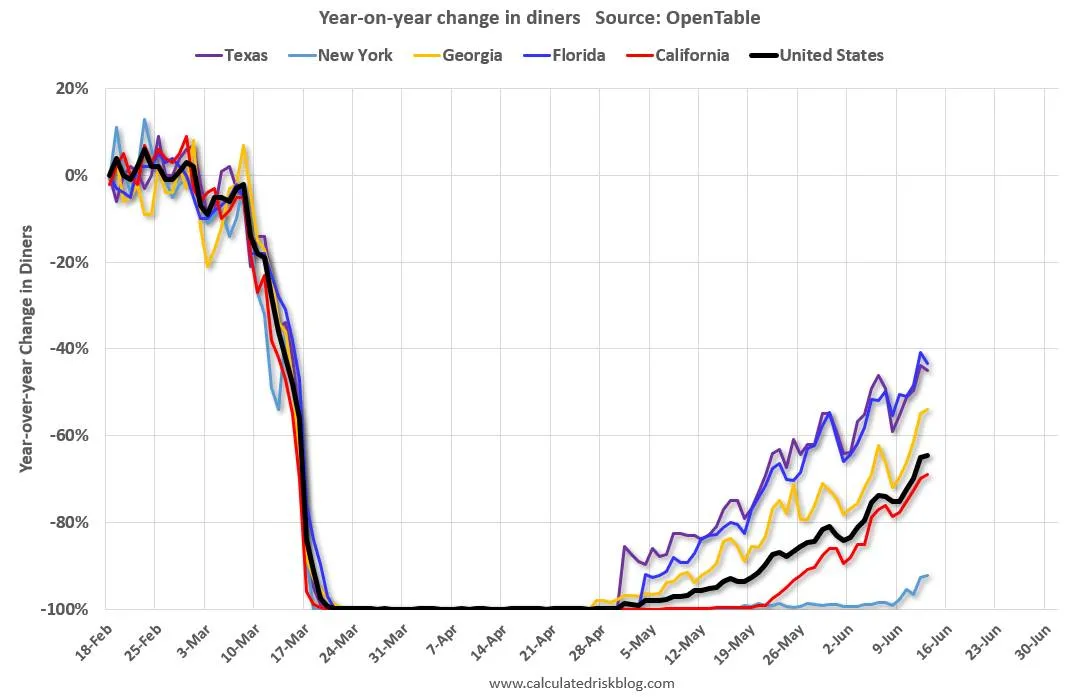
You can see that everyone went essentially to zero, with California hitting bottom first and Florida just a week behind.
Since then, Florida and Texas have rebounded to an astonishing 55%+, Georgia in the mid 40s, and US average around 35%. California is surprisingly high at 30%, and New York is just starting to approach 10% in the last week.
Those are some pretty huge differences.
Gasoline Consumption
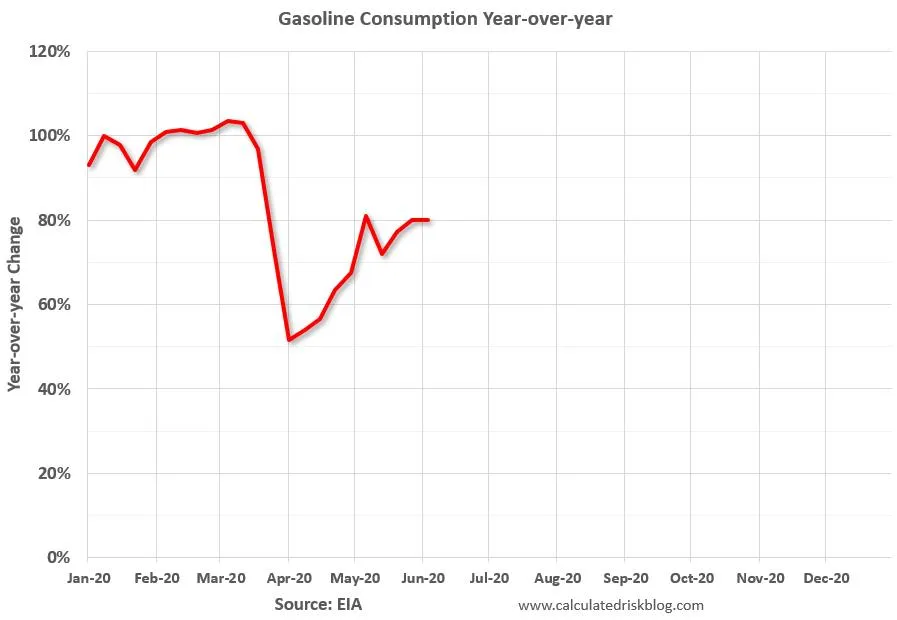
Obviously a lot of gas consumption falls into the "essential" category, but nationwide we're about halfway back from the mid April low. I'm surprised this measure declined so slowly, it shows no change until well into April.
Transit
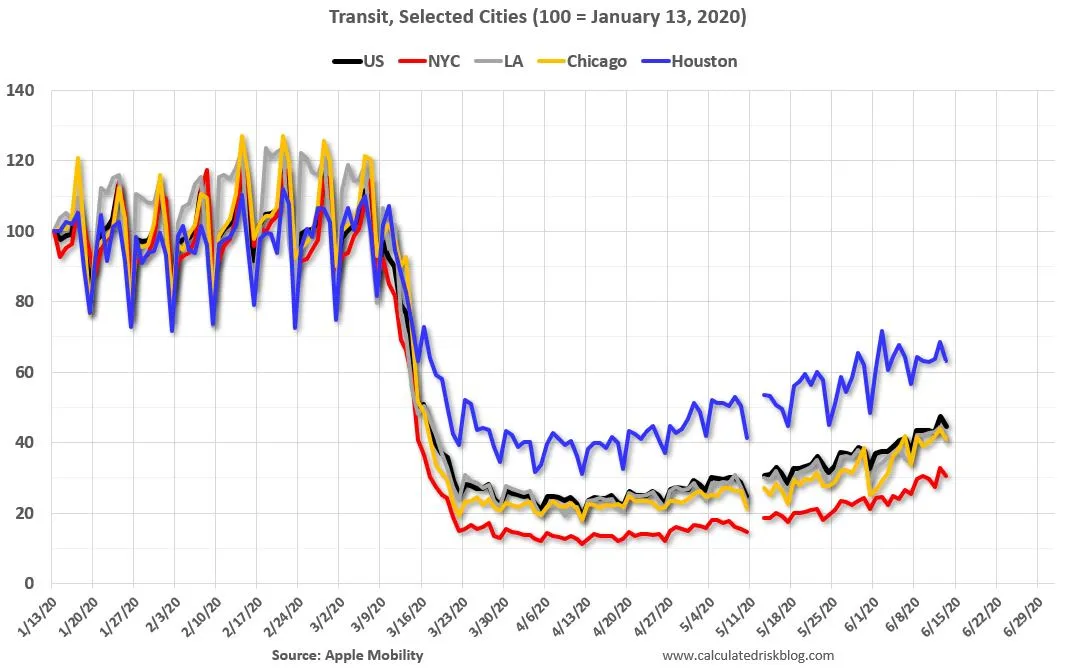
Usage of transit in selected cities. Houston less of a decline throughout, NYC more, others near US average.
California Transit
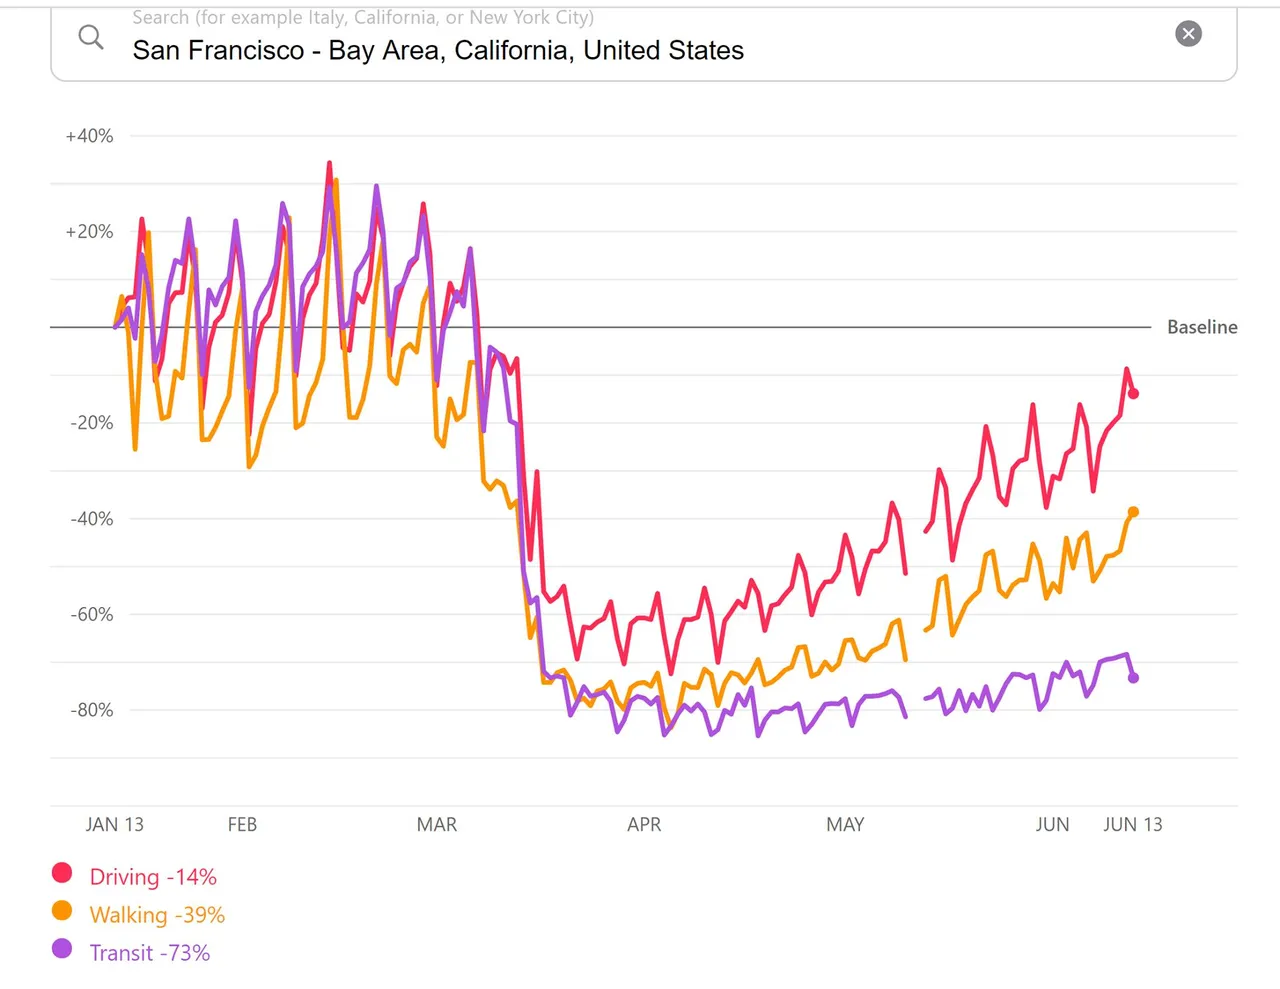
What's up with California? It's acting like two different states. The bay area:
Driving still below pre-COVID baseline, walking far lower, transit still down 70% and near recent lows.
Compare to LA...
Los Angeles Transit
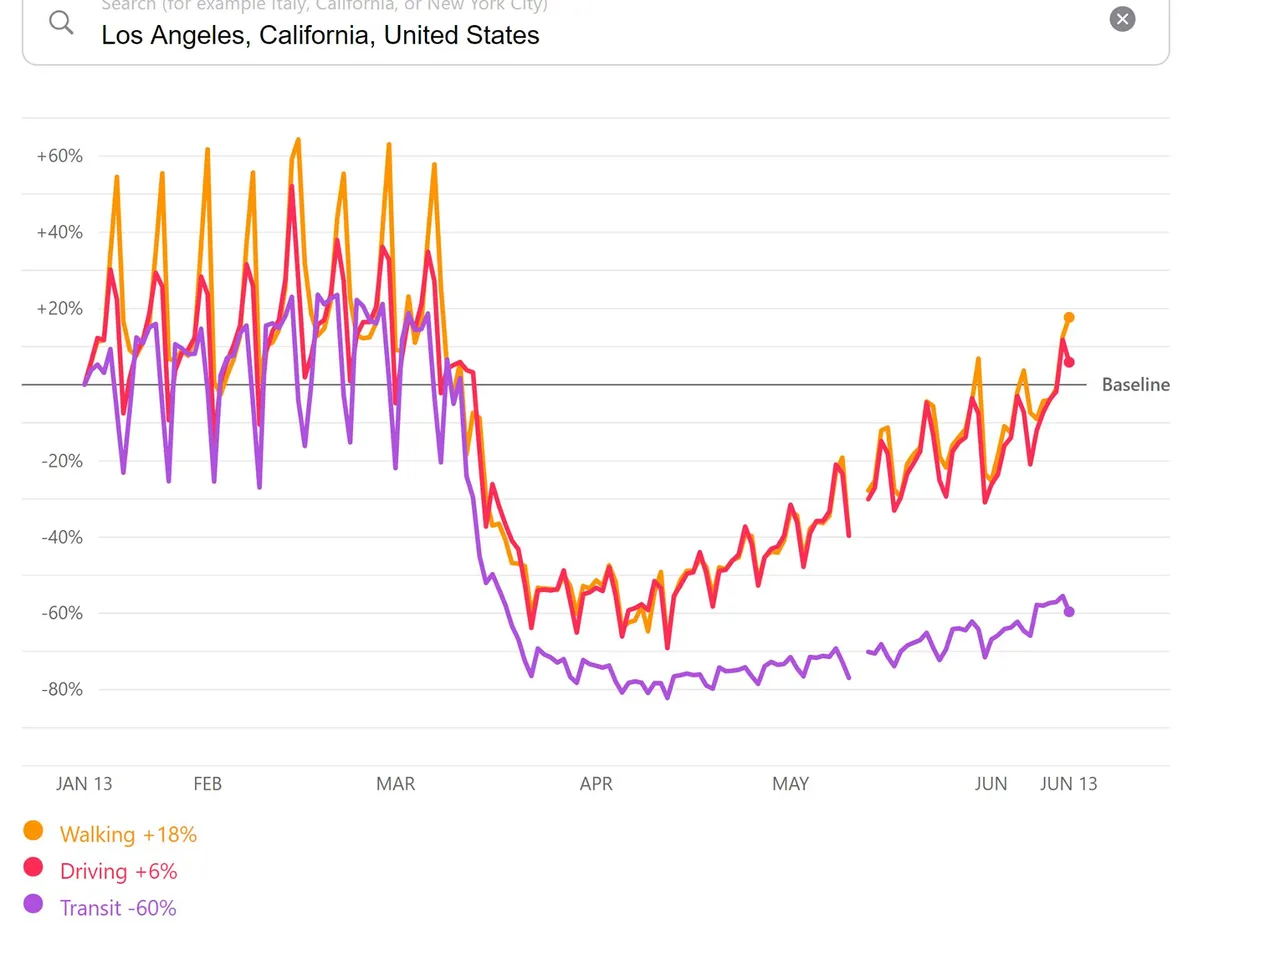
LA has transit about 1/4 recovered but still low, but walking and driving are a bit above baseline, as they were right before the epidemic.
So LA is close to back to normal while the bay area is still well below normal. (LA and inland CA are seeing much higher infection rates.)
Houston Transit
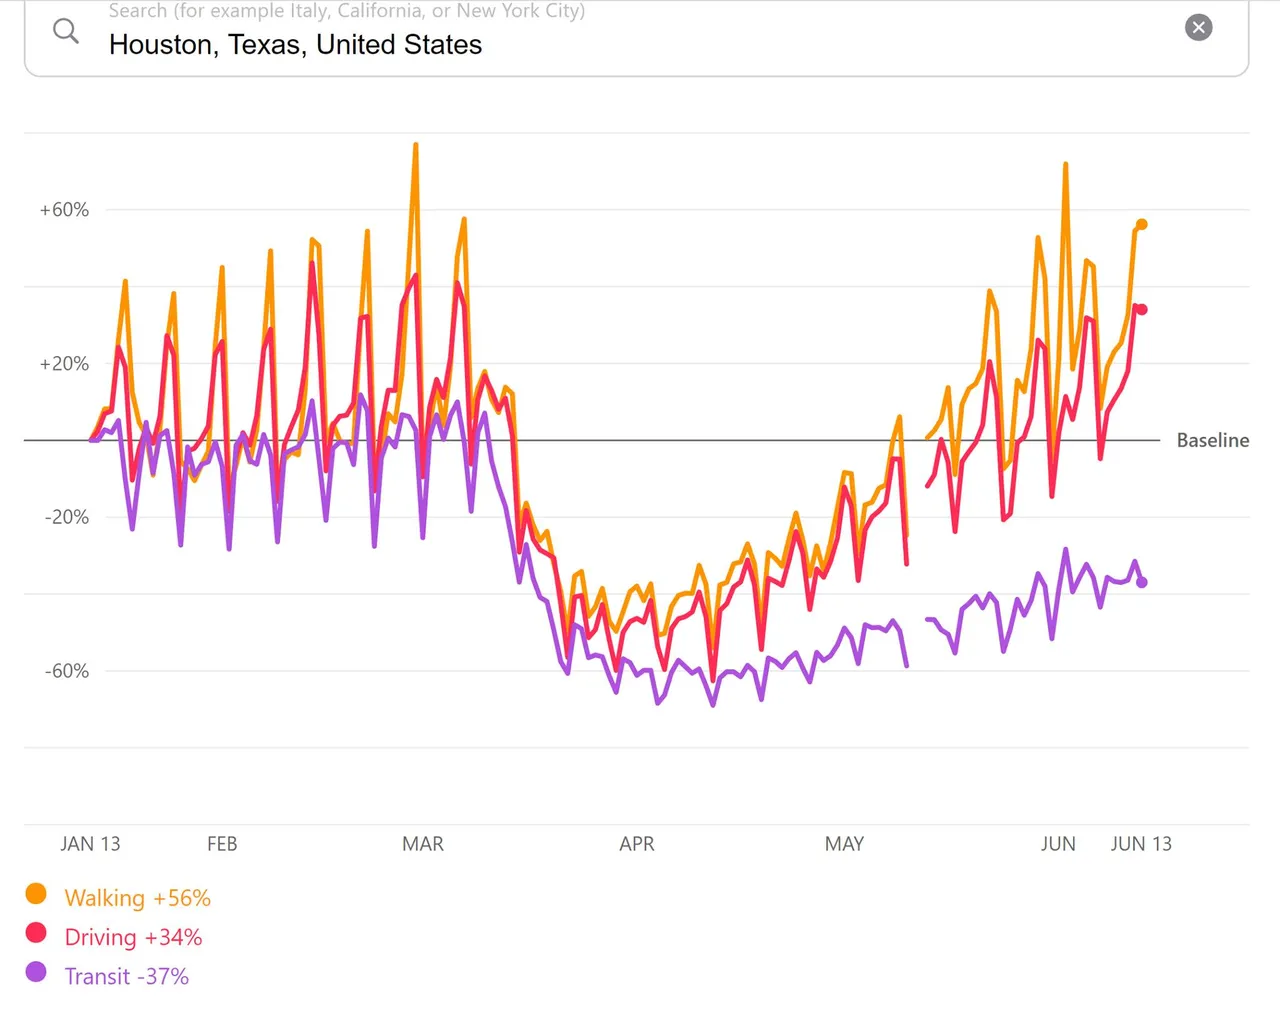
Houston's driving and walking are into exuberant territory, they've been business as usual for weeks now. Yee-hah!
Miami Transit
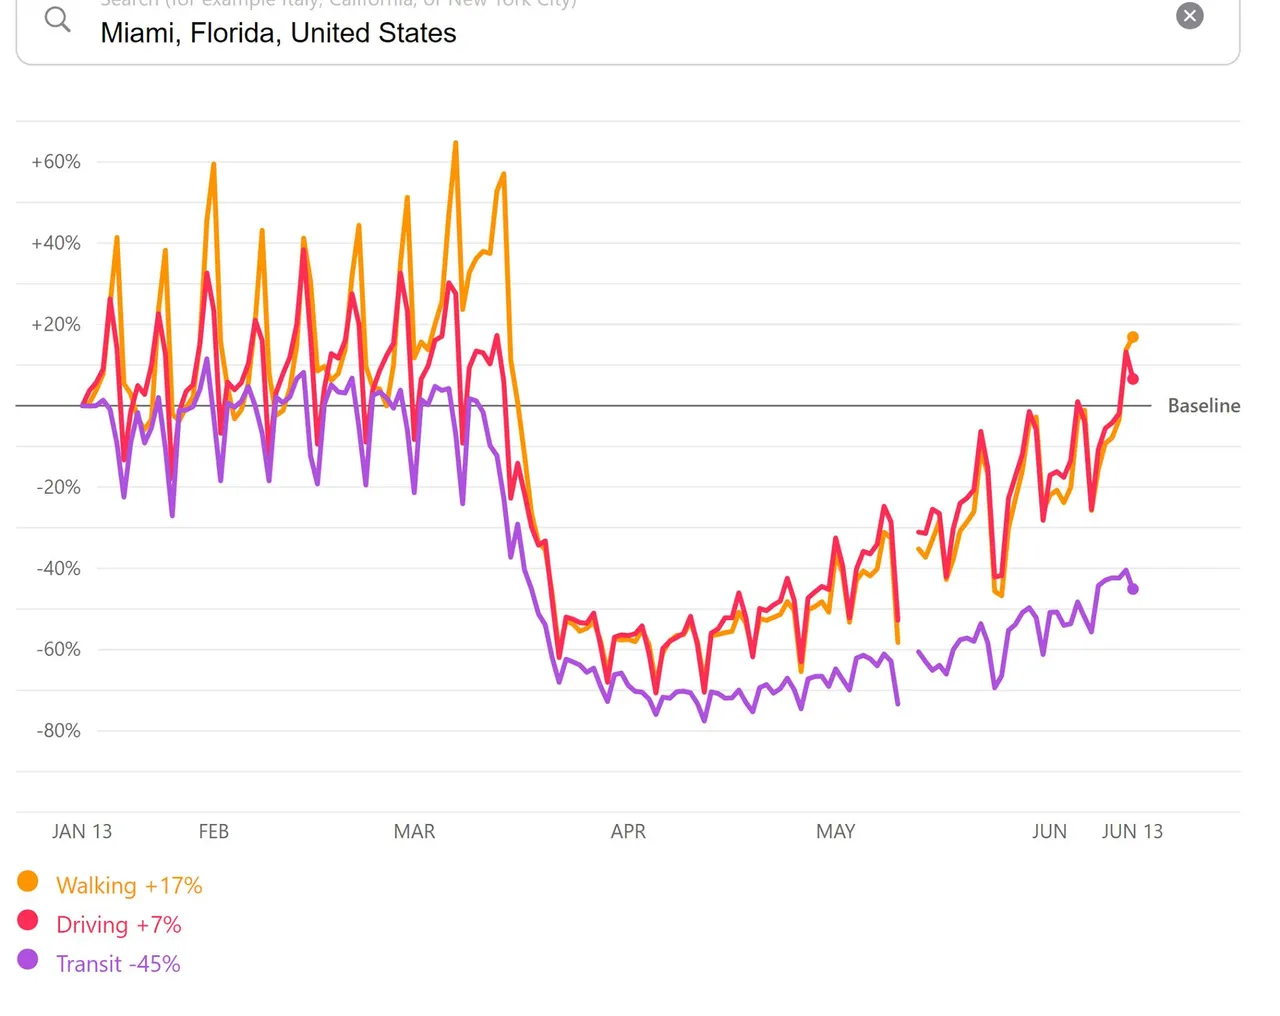
Miami is looking a lot like LA, just now approaching pre-lockdown levels.
Phoenix Transit
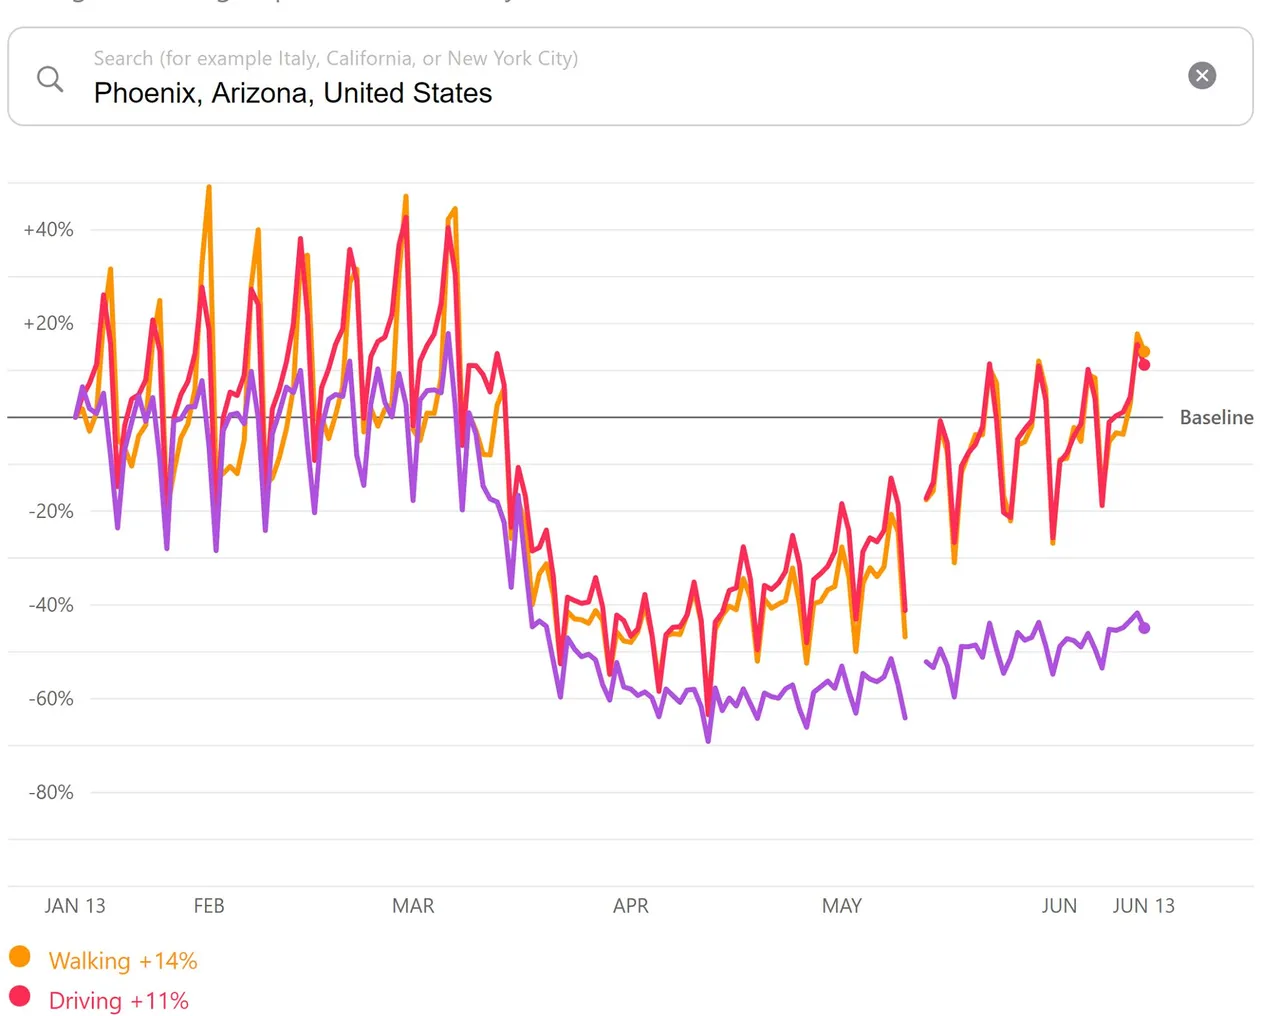
Phoenix approached pre-lockdown levels 2-3 weeks ago, steady since. (Does Phoenix activity decline as the heat sets in? Not sure what their normal is.)
Chicago Transit
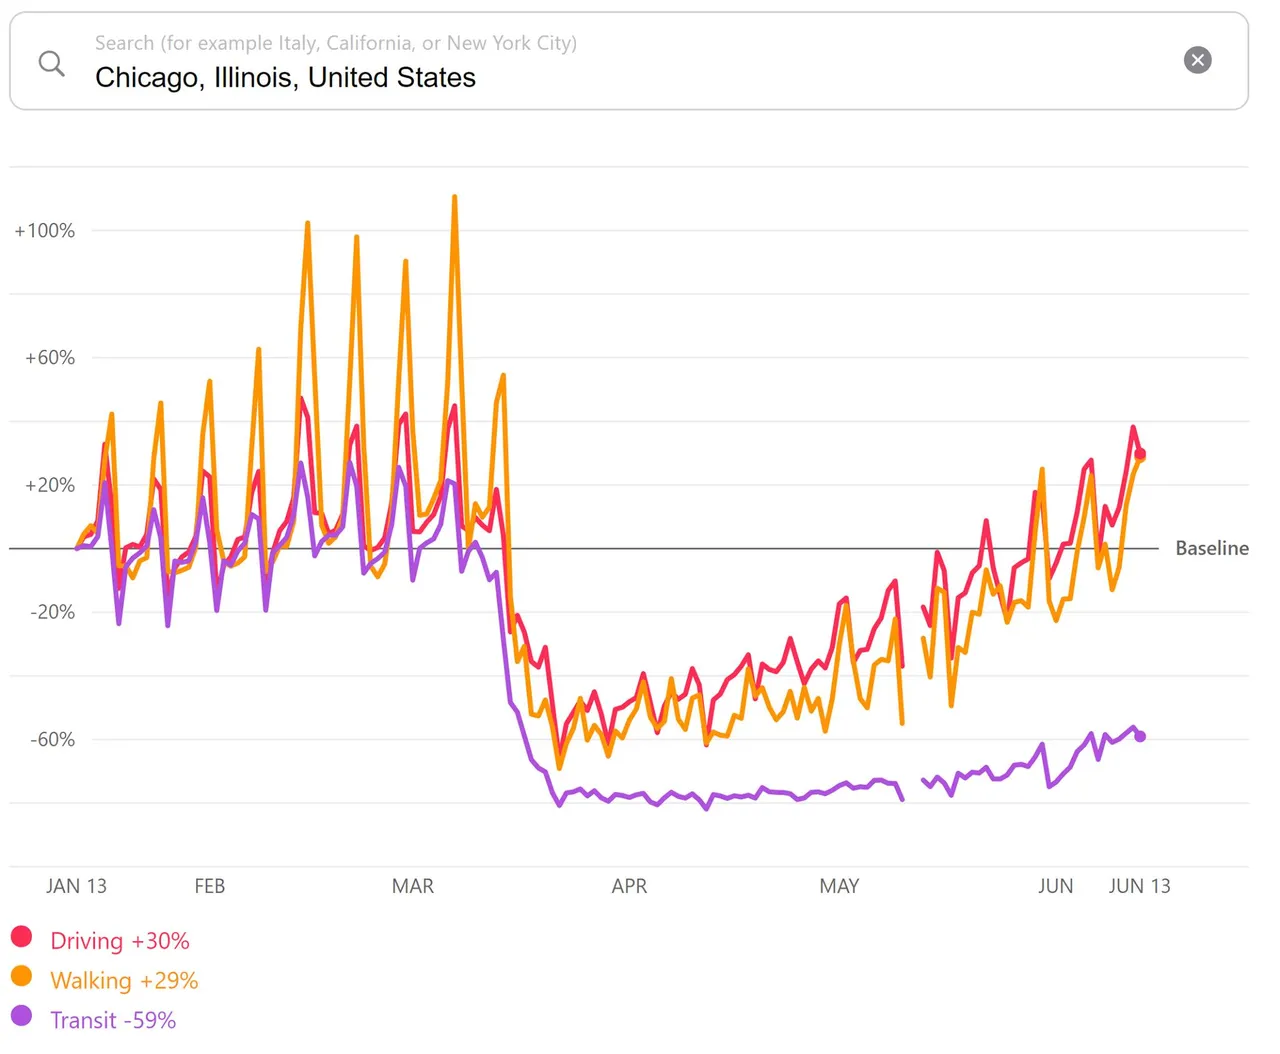
Chicago seems mostly back to normal a couple of weeks ago, but Illinois isn't spiking the way Arizona is. Maybe just a matter of time? Maybe mask use differences? Dunno.
New York City Transit
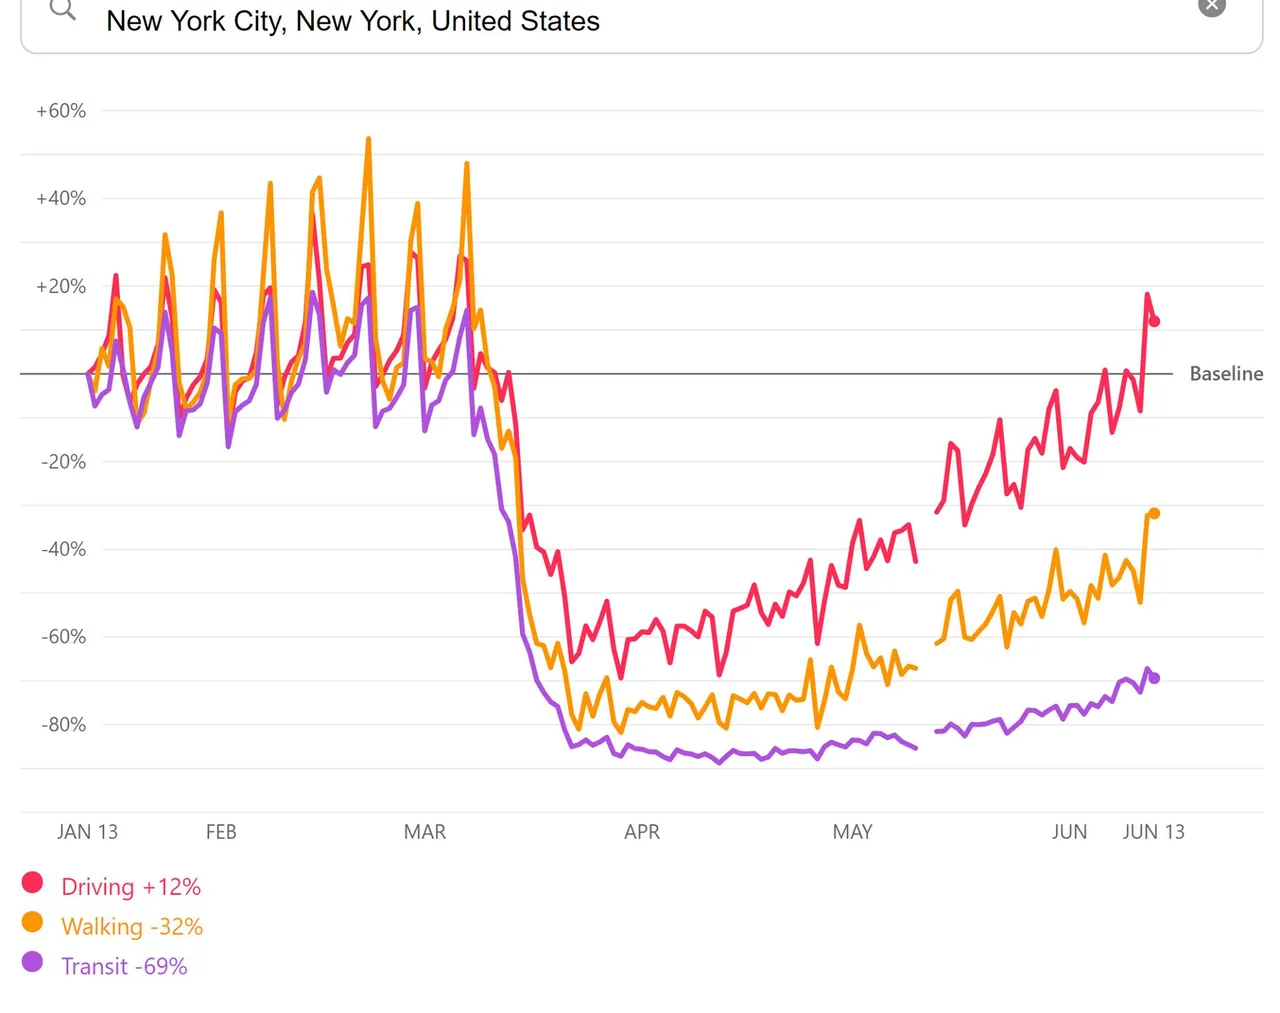
New York City: Driving back to normal, walking much reduced.
So we've seen some real behavior differences with NY and SF on one extreme, and some southern cities on the other end. It seems to line up pretty well with the COVID case curves except for Chicago and Illinois.
I wish we had hard data on real test-trace-isolate activity. Anecdotally, TX seems to be doing essentially nothing despite being listed as having thousands of contact tracers.