
I’ve noticed lately that several threads in our national dialog about COVID-19 and how to manage it have been missing a key point. I’ve boiled it down to this statement:
“It takes less effort and fewer restrictions to maintain the daily death rate at 100 than it does at 1,000 or 10,000.“
That’s not hyperbole--I claim it is literally true. If you accept that, there is only one rational approach to riding out the remaining 6 or 12 or 24 months to a vaccine: the easy way out that also leads to fewer deaths.
It took me a while to accept it when it first occurred to me. I’ll need to go over a bit of background and vocabulary to show why it’s true.
Wildfire, Mitigation, and Suppression
There are three main strategies to managing the level of COVID-19 infections and deaths in a country. I’ll define what I mean by these titles.
Wildfire is the worst-case scenario of doing absolutely nothing while the epidemic rages. No country is intentionally following this strategy. In a wildfire scenario, SARS-CoV-2 is contagious enough and deadly enough that it will quickly overwhelm any nation’s health care system, and the fatality rate (as a percent of infections) will get far worse because of the lack of medical care. Wildfire is also likely to lead to massive disruption of key infrastructure and supply chains as too many workers get sick simultaneously, which further adds to the death toll. This was the terrifying high peak from the March Imperial College Report, and the scary left curve of the popular “flatten the curve” memes. Essentially nobody is suggesting this as a viable strategy.
Mitigation is that name I use for a strategy that rejects the Wildfire approach, but doesn’t attempt to keep infections and deaths at a very low level. Other writers use somewhat different definitions for mitigation; be sure to check how each defines it. Under a Mitigation strategy, “NPIs” (non-pharmaceutical interventions, i.e. lockdowns, mask mandates, prohibitions on large events, contact tracing, etc.) are employed to keep infections, hospitalizations and deaths below some key threshold, typically hospital or ICU capacity. The reasons vary, but major threads are “we’re all going to get it eventually”, “the goal of flattening the curve was to keep hospitals running”, or “let’s get to herd immunity with as little pain as possible.” The mitigation strategy keeps infections and deaths at a relatively high but “acceptable” level until a vaccine is available, or until herd immunity finally begins to slow the death rate in a gradual wind-down.
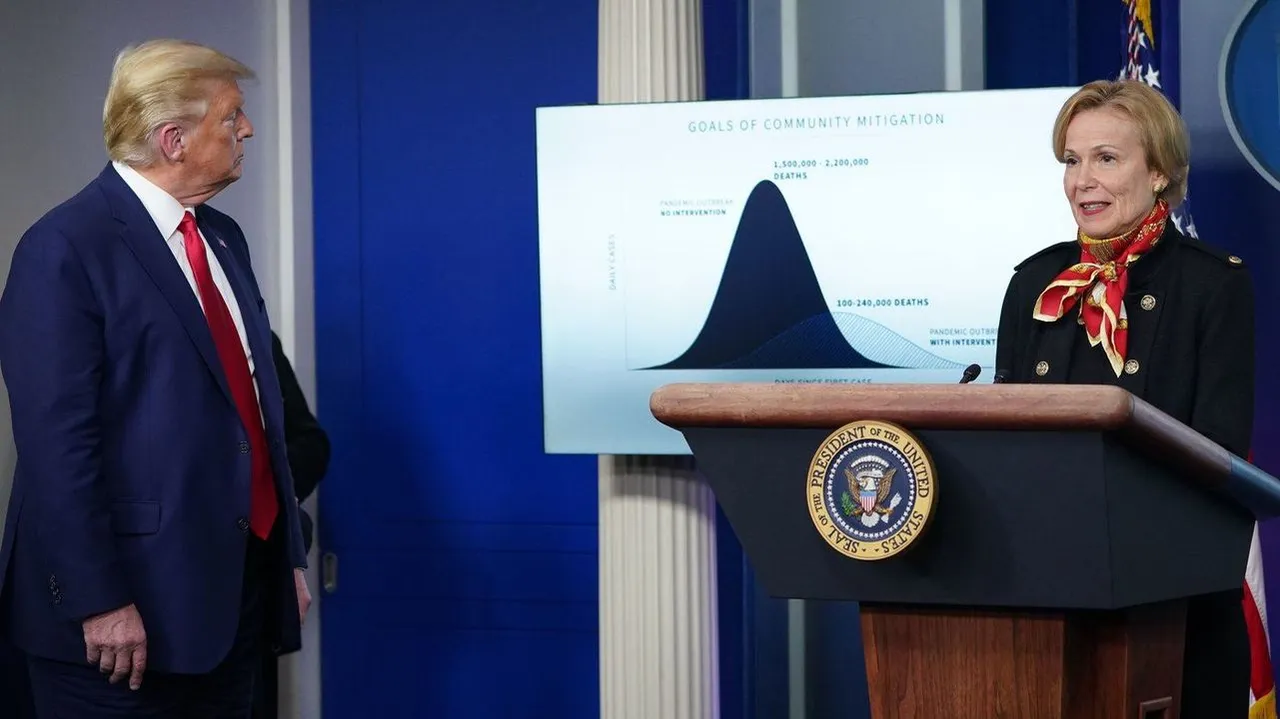
Suppression is the name I use for a strategy that aims to keep the infection and death rates at a very low level. It’s the much lower right-hand curve on the “flatten the curve” memes, and on the Trump/Birx chart with the unfortunate title “Goals of Community Mitigation”. (Mitigation and Suppression are used interchangeably by many authors, but I’m making a key distinction in the terms.) Once the infection and death rates are brought down to a low level, NPIs are employed to keep them there until a vaccine is available. If a vaccine is available at any time over the next several years, a Suppression strategy means that the overwhelming majority of people will never be infected.
There are other strategies. Sweden’s strategy is somewhere between Mitigation and Suppression. They’re not explicitly rushing toward herd immunity, nor were they in a hurry to get infections to a very low level. They chose a level of NPIs they were comfortable with, and let the infections go as they may, presumably with the option to tighten later if they were too high. As a result, their curve follows a course somewhere between Mitigation and the Suppression strategies used by the other Nordic countries.
Eradication is an extreme form of suppression, with the goal of keeping zero transmission or as close to it as possible. New Zealand is the leader in this respect, but it could be argued that Taiwan, South Korea and others are using this approach. In practice, there’s no sharp dividing line. Eradication is indistinguishable from a suppression strategy that chooses zero or near zero as the target.
The US hasn’t explicitly committed to Mitigation or Suppression. As the debates continue and states implement disparate strategies, the net result is equivalent to a milder Mitigation strategy - somewhat lower deaths than a more permissive strategy, but too high for the benefits of a Suppression strategy.
To illustrate and contrast these strategies, I constructed an extremely simple SEIR model. It is not intended to be a forecast or a precise model, just a tool to illustrate the primary differences in the effects of Wildfire, Mitigation and Suppression strategies. It illustrates what could happen if the the US adopts one of the three strategies today.
If you don’t want the details, skip this paragraph. The model assumes that true infections are running around 160,000 per day so testing is confirming about 1/4 of the true total, and that 40 million Americans have already been infected. Totally homogeneous population, R0 of 2.5, IFR 0.5%. (Yes, I know the population isn’t homogeneous, that R0 may be higher than 2.5 especially in urban centers, that IFR may be above or below 0.5 and may increase or decrease over the winter. None of these change the qualitative differences between the strategies.) In this example, Mitigation targets a limit of one million infections and 5,000 deaths/day; Suppression targets a limit of 20,000 infections and 100 deaths per day. These values are arbitrary and represent values near the extreme for either approach to highlight the differences. It would be entirely possible to choose a Mitigation death limit of 2,000/day, or a Suppression death limit of 300/day, etc. This is not a forecast, it’s a simulation to illustrate the differences in the strategies.
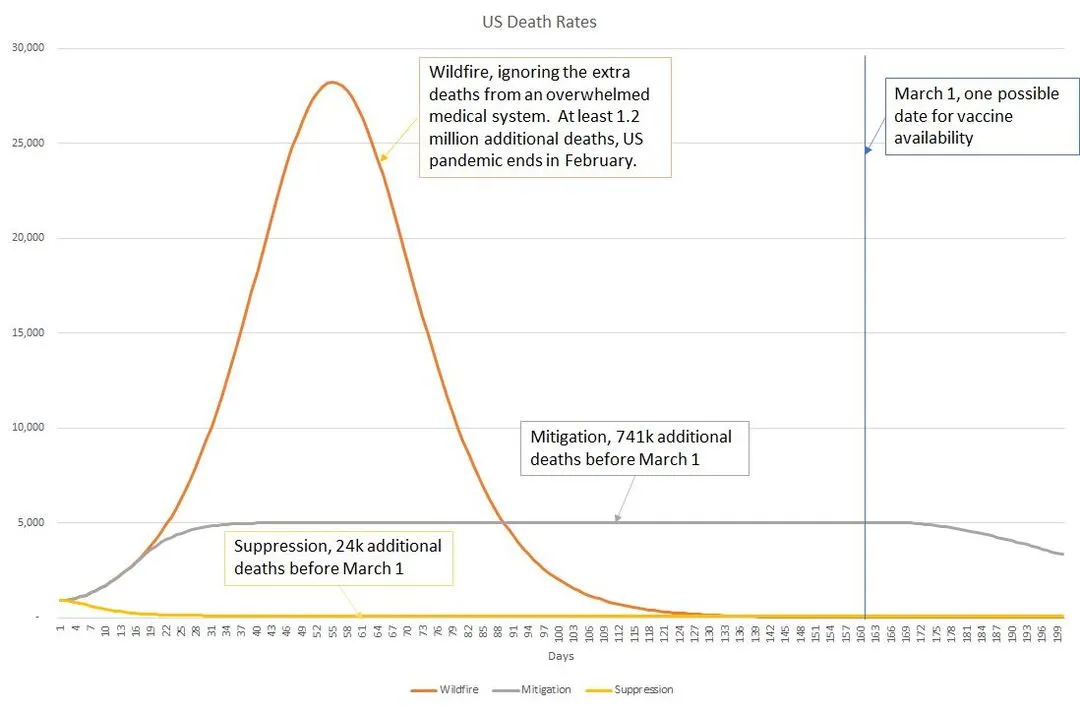
I’ve added an arbitrary line on March 1 as a hypothetical vaccine introduction date, which will obviously change all the strategies. Whether it’s January 1, March 1, or even July - it doesn’t significantly change the differences between the strategies. Notice some key points. First, Wildfire would result in far more than the 1.2 million extra deaths shown here as a collapse of the medical system and supply chains would raise the fatality rate far higher. Second, note that as I’ve defined them, Mitigation and Suppression end up with parallel death rates until at some point - April in this simulation - the leading edge of herd immunity starts to reduce the death toll on the Mitigation strategy and it gradually declines toward zero.
With the vocabulary defined, I’ll restate my claim. “Suppression requires less effort and fewer restrictions than Mitigation, while reducing illness and death.”
Much of the current policy debate is framed around the notion that we have two choices. One, preferred by the left, is to use a higher level of NPIs (gathering restrictions, mask mandates, etc.) enduring a higher economic cost and greater “collateral damage” (depression, suicide, substance abuse) in order to reduce the number of illnesses and deaths. The other, preferred by the right, is to use less stringent NPIs, and accept a higher level of illnesses and death in order to avoid the economic and collateral damage caused by the stricter NPIs. This is a false dichotomy.
In order to maintain a steady state of infections and deaths, Rt (the rate of transmission per infected person) needs to be held at 1. The effort required to maintain Rt at 1.0 is almost entirely independent of the current rates of infection. With one major exception, all the NPIs - hand washing, mask wearing, restaurant and bar restrictions, prohibitions on large gatherings - have the same impact on reducing R0 to an Rt goal of 1.0, no matter what the current rate of infections may be.
Think of it this way. Let’s say that mask wearing reduces spread by 1/3 (vs. no masks) in contacts between people. Going to 100% mask use vs. no masks at all will reduce the rate of new infections by 1/3, whether the epidemic is raging or nearly eliminated. Similarly, closing bars or opening schools or limiting churches to 50 people - all have an impact that doesn’t change with the rate of infections. In all these cases, they can be thought of as having a percent increase or decrease in the chances of spreading.
In the context of the graph, reopening or easing restrictions changes the slope of the line, regardless of whether it’s at a high or low level. If the line was heading down, easing may cause it to head down more slowly, or flatten, or even start heading up. If the line is heading up, tightened restrictions will slow the increase or even reverse it.
There are two major exceptions to this rule: testing and contact tracing. Because resources are finite, they don’t scale with the scope of the outbreak. In a city or county with 100 cases per day, testing may catch half of the new cases, contact tracers may be able to contact most of them and get in touch with some of their contacts, and they may make a significant different. At 1000 cases per day, testing is going to detect a smaller fraction of the true cases, and overwhelmed contact tracers can’t begin to keep up. At 10 cases per day, testing can detect most case, tracers can contact all of them and all key contacts, in addition to backtracking to identify unknown chains, and upstream and downstream contacts can be traced. It even becomes feasible to provide free quarantine lodging for those who want to protect other members of their household, and to provide follow-up services (grocery delivery, medical follow-up) to the isolated patients and repeated testing for the exposed contacts.
Because testing and tracing become more efficient at lower infection levels, it takes less effort and fewer restrictions to keep Rt at 1.0 when the infection rate is low. This is why a suppression strategy allows more freedom and fewer restrictions than a mitigation strategy. A suppression strategy reduces illnesses, reduces deaths, costs less, and allows greater freedom than a mitigation strategy.
The benefits are not entirely free. To enjoy the benefits of a suppression strategy, a short period of tight restrictions will be needed to reach the low suppression level, after which the benefits roll in for the entire duration of the pandemic. I’ll follow up in a lot more detail in future updates, but for now I’ll simply state that a very intense 2-3 week lockdown can be much more effective than a 12 week softer lockdown. (A 50% reduction in contacts drops Rt from 1.8 to 0.9; an 80% reduction yields Rt of 0.36, which reduces infections more than six times faster!)
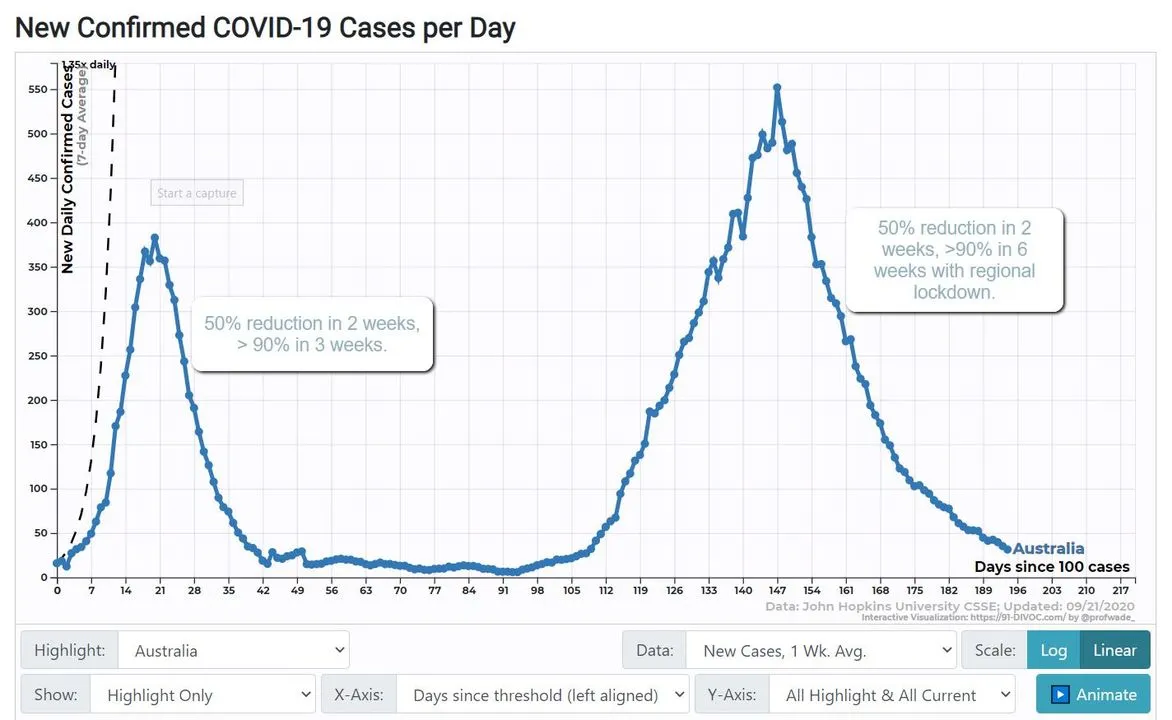
Australia had an initial outbreak early in the pandemic. More recently, Melbourne and the state of Victoria had a major outbreak. In both cases, moderately strict measures brought the case count down with impressive speed. In the latter case, the restrictions were mostly limited to Victoria (or Melbourne itself) but were still enough to move the nation’s totals very quickly.
This illustrates that a short period of strong interventions in the areas with significant outbreaks can bring a country to suppression levels in a very short period of time. The US experience with lockdowns - uncoordinated, varying in intensity or entirely skipped, reopening long before suppression was reached - is not typical and is largely ineffective outside of the regions that took it seriously. (California, Florida and New York were able to reduce infections by roughly 50% in three weeks, while rates were climbing in other states.)
When a country approaches suppression levels of infection, contact tracing becomes extremely cost effective and, if done well, can reduce the need for most other restrictions. Multiple countries have shown that contact tracing and mask wearing can carry nearly 100% of the load, allowing schools, restaurants, bars and personal gatherings to go on at nearly normal levels.
Conclusion: After a brief period - two weeks in low infection areas, six weeks in outbreak areas - a suppression level of infection, with few illnesses and deaths, can be maintained with less effort and disruption than our current status quo. The assumed trade-off between high deaths and freedom is a false choice; a bit of discipline up front followed by mask wearing and an investment in contact tracing can give us more freedom, fewer deaths and lower costs at the same time.
Caveats: I’ve glossed over a lot of fine points that change some of the details but not the overall picture or conclusions. I intend to address many of them in more detail, but I’ll just mention them here for completeness so readers can be aware that I haven’t overlooked them.
I am aware that, over an extended time, a mitigation strategy begins to benefit more from partial herd immunity. At any reasonable level of deaths, this happens very slowly, but it would gradually allow a mitigation strategy to exist at the same effort as a suppression strategy, and eventually a lower cost if a vaccine is delayed for many months. If you put any value at all on reduced illness and death, however, the break-even point is years in the future.
On the other hand, even if eventual costs were equivalent, delaying infections to future months has another upside, as the fatality rate decreases. We’ve already seen the fatality rate drop at least 50% and perhaps 70% or more; future progress means that there’s a lot to be gained by delaying infections even if the total number infected were to be the same.
Different assumptions about R0, Rt and herd immunity thresholds produce different details, but the broad differences between mitigation and suppression remain. I have chosen to model an R0 of 2.5 with a homogenous population, fully aware that they’re radical simplifications. We don’t know where the threshold for herd immunity is. I believe there is strong evidence that it’s beyond 50% in most communities, and possibly above 70% in dense urban areas. It will vary with population density and season. T-cell cross reactivity research has little to no impact on herd immunity; its main influence is on severity and death rates, as patients are still susceptible to infection but recover more quickly. Studies showing some groups with seroprevalence well above 50% are further evidence that herd immunity is reached at 50% or perhaps much higher. If, however, herd immunity were to develop at 15% or 20%, a some of the benefit of a suppression strategy would be removed. Even then, if a vaccine is available in roughly Q1 2021, there are cost and mortality benefits to suppression, but the magnitude of difference would be smaller than illustrated in my model.
I am aware that at extremely aggressive levels of suppression, international travel restrictions are needed to limit infection from higher risk countries. Mitigation strategies are less affected by imported infections. This is a small savings relative to the cost of other NPIs, but I mention it for completeness.