
SUMMARY
Since February of 2017, ZEC has been traveling within a broadening pattern and thus far, waves A,B,C and D seem complete with E still remaining to go. Usually, these patterns with one more remaining wave can help identify the next overall market tops since once the remaining wave is placed, a sizale decline can be expected and this decline can be translated into the Cryptosphere.
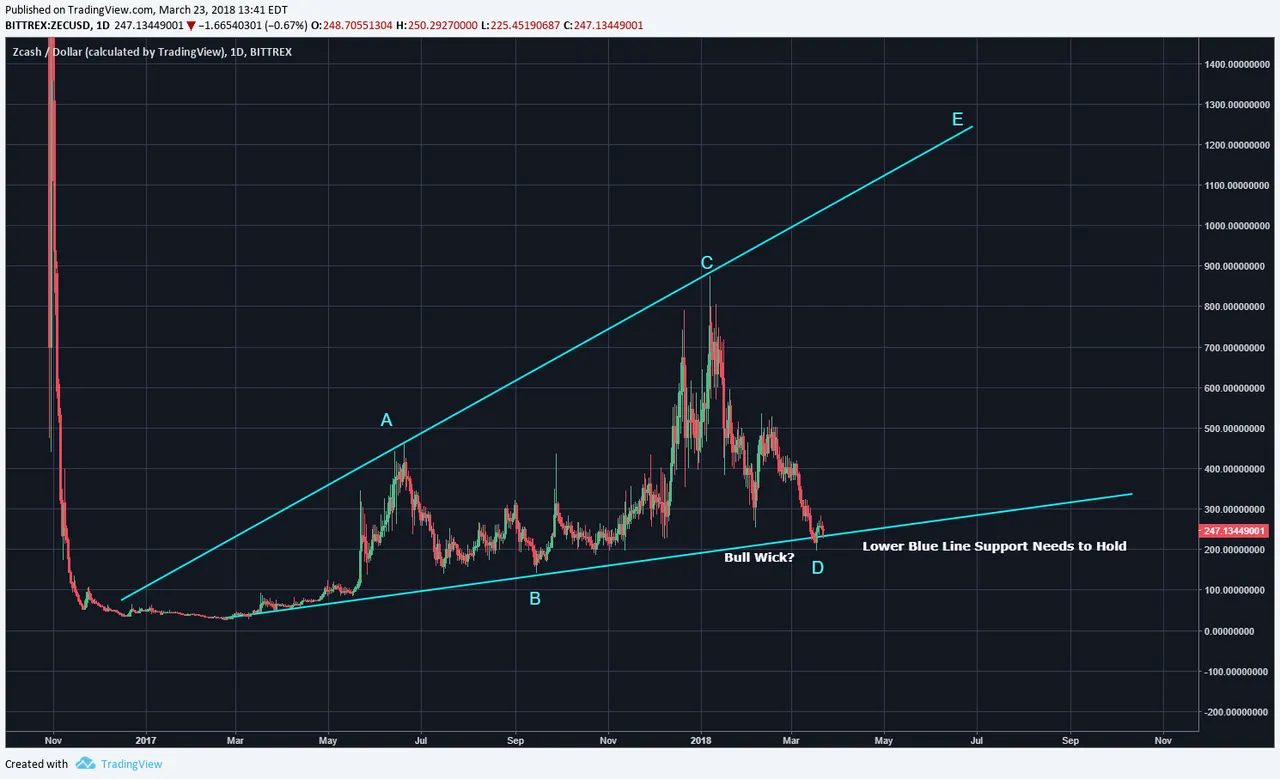
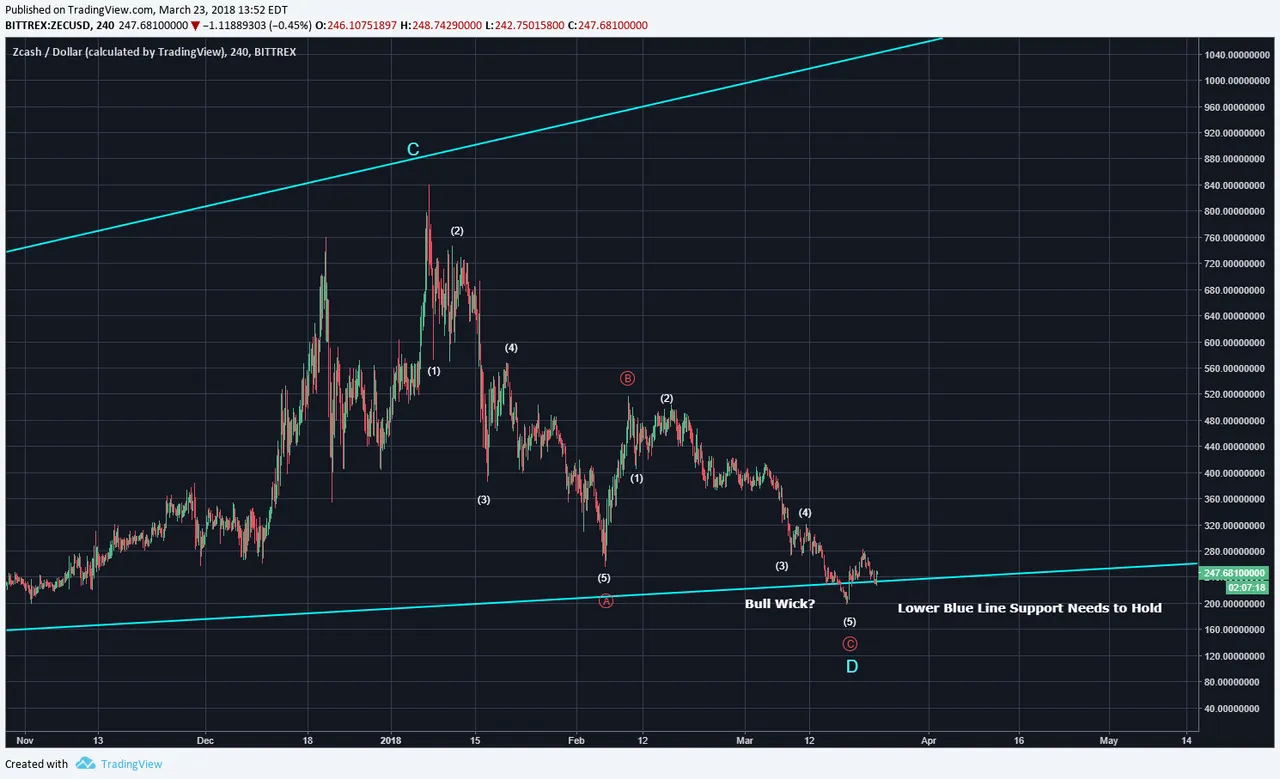
Subwaves cound as a ZigZag with 5,3,5 subwaves for A,B, C. The bottom blue support line has been pierced and thus far could be a candidate for a bull flag. This support line needs to hold. Let's see if price can pick itself off the floor and start impulsing upwards.
Legal Disclaimer: I am not a financial advisor nor is any content in this article presented as financial advice. The information provided in this blog post and any other posts that I make and any accompanying material is for informational purposes only. It should not be considered financial or investment advice of any kind. One should consult with a financial or investment professional to determine what may be best for your individual needs. Plain English: This is only my opinion, make of it what you wish. What does this mean? It means it's not advice nor recommendation to either buy or sell anything! It's only meant for use as informative or entertainment purposes.
Please consider reviewing these Tutorials on:
Elliott Wave Counting Tutorial #1
Elliott Wave Counting Tutorial #2
Elliott Wave Counting Tutorial #3
Laddering and Buy/Sell Setups.
Laddering Example with EOS
Tutorial on the use of Fibonacci & Elliott Waves
@haejin's Trading Nuggets
Essay: Is Technical Analysis a Quantum Event?
Follow me on Twitter for Real Time Alerts!!
Follow me on StockTwits for UpDates!!
--
--

