XLM/ETH - Bittrex
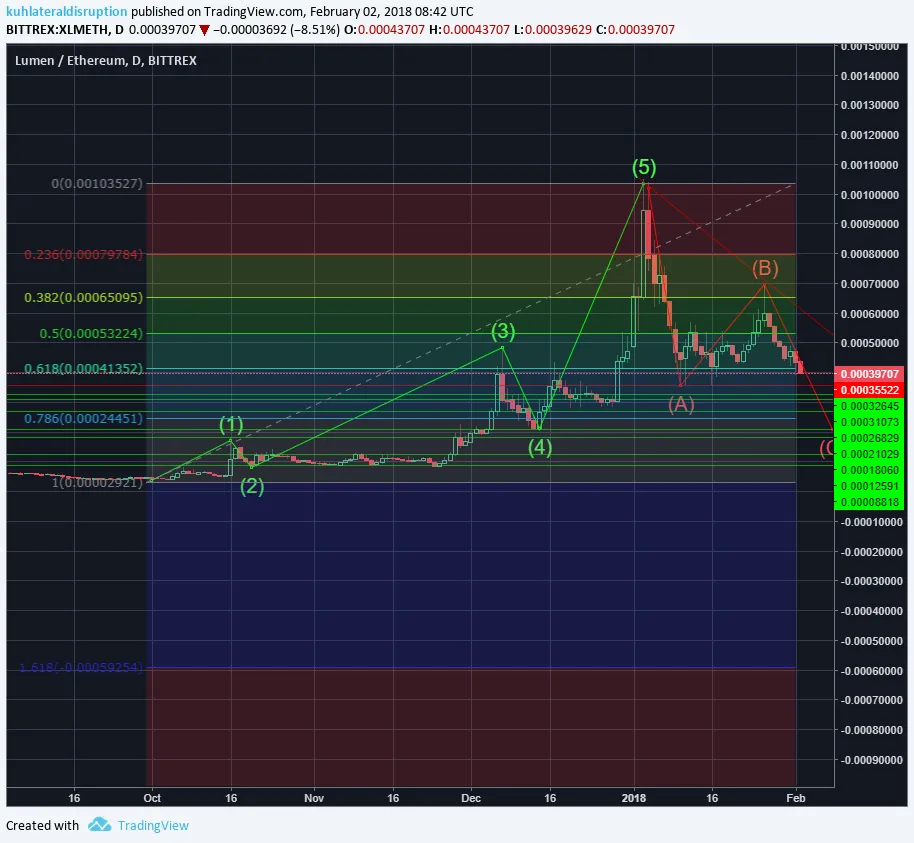
XLM is currently in a correction state. By Elliot-Wave Theory, the initial 1-5 waves up (green) are followed by a requisite correction wave, labeled (red) ABC, C being the end of the correction.
XLM is also showing a bearish descending right triangle, and could possibly break through .00035522 eth level very soon as the MACD (red circle) is showing bearish signal.
We may bounce off that support level and go up, but will hit the top of the triangle and continue down.
Once the .00035522 eth support level is broken we will see it continue down to one of the indicated (green) support levels where it may find its bottom. (buy ladder would be a good idea)
I think we could find a bottom at .00026829 eth (near the .786 retracement level), and then continue our trend upwards to .00173629 eth ($1.56 USD at current ETH price levels), but not without corrections in between.
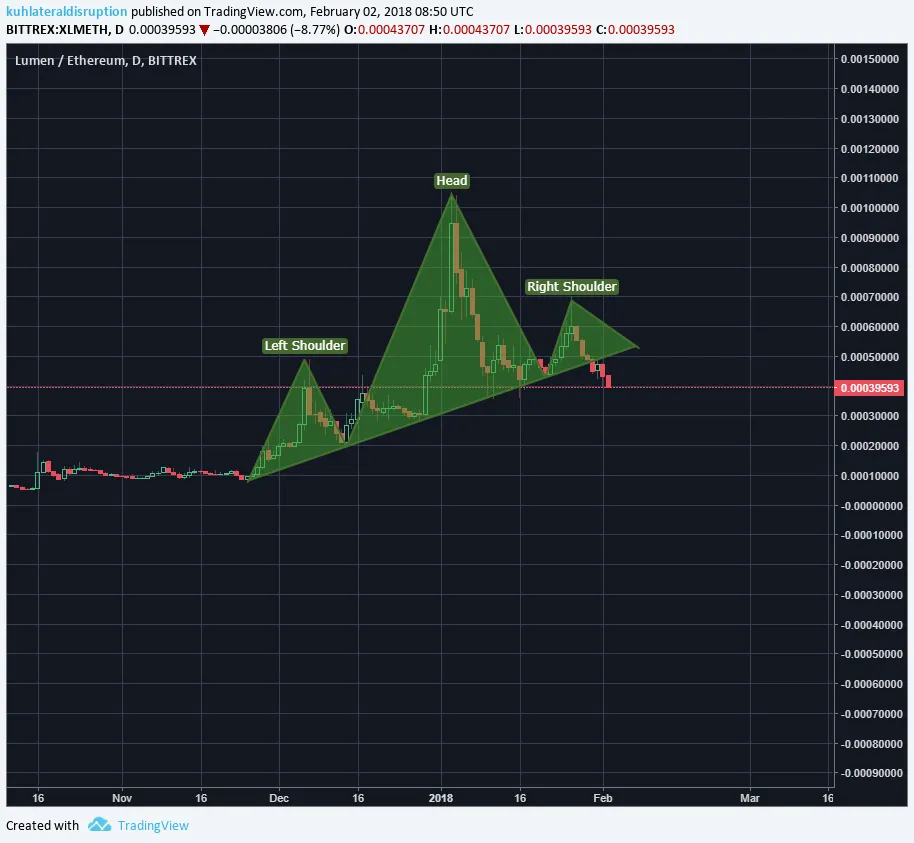
Another bearish indicator would be the completed head and shoulders it has formed. Now that it has breached the neckline, complimented by the MACD, a further drop is likely.
Another thing to notice is XLM's fracatal behavior.

Specifically, these 2 fractals
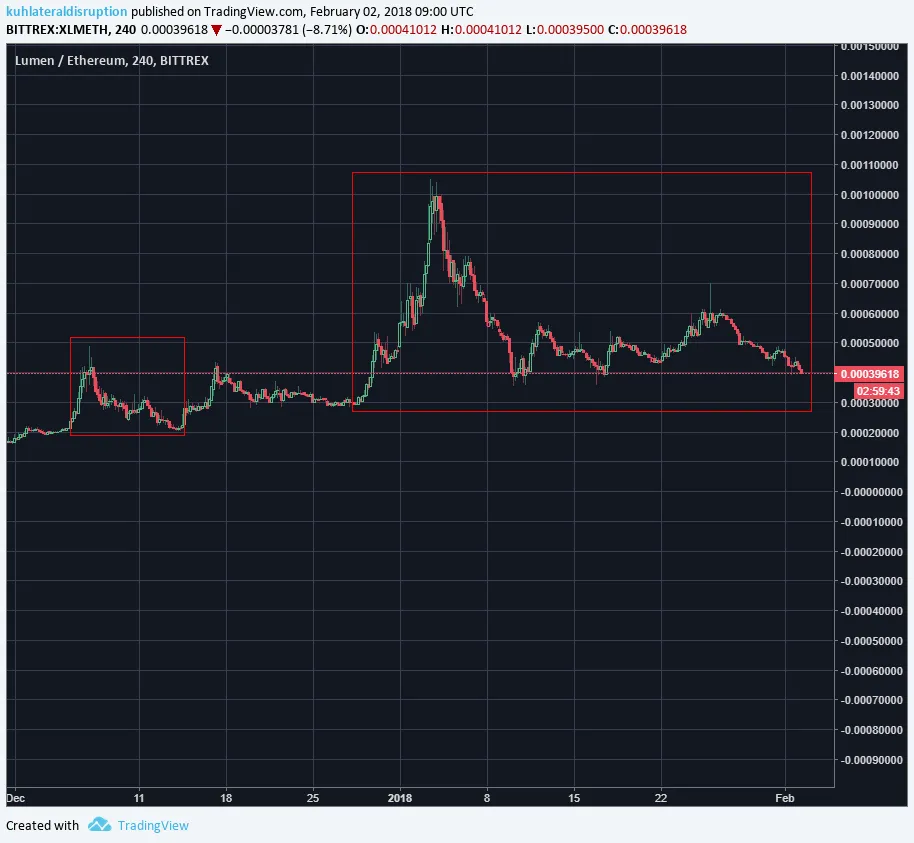
Looking at these fractals, we can see that if the second fractal follows the first fractal, it also indicates a bearish signal. What could be happening right now is that first initial fractal could be the baby fractal, the bigger fractal we see currently forming would be the Mama fractal, and the the next moon in price will produce the Papa fractal which will be much larger then the previous Baby and Mama fractal.