Over the last year, I have been introduced to Elliott Wave Theory and have learned to use it in trading cryptos. More recently, I have looked into the more specific "Fibonacci Pinball" method described by Avi Gilburt's group. I have never subscribed to any of their services, but they have an Education section of their website, which includes an introduction to their Fibonacci Pinball method as well as a more detailed presentation on the topic.
I have decided to practice their method and use this blog to document my analysis for my own purposes.
I am not a financial advisor. Do not consider this to be financial advice. I am posting it here for my own practice and future review only.
Today I wanted to take a second look at Whitecoin. Last time out, I mentioned that I found that XWC doesn’t correlate with BTC’s price movement as much as some other coins. Today I decided to take a closer look at that since a number of the analysts that I follow seem to think that a new low for 2018 may be in the cards for BTC. If that happens, will XWC get smashed like most altcoins?
In the first chart, BTC price is shown with the orange line. We can see that XWC had significant price gains on three occasions (green rectangles) when BTC was either sliding in price or going sideways.

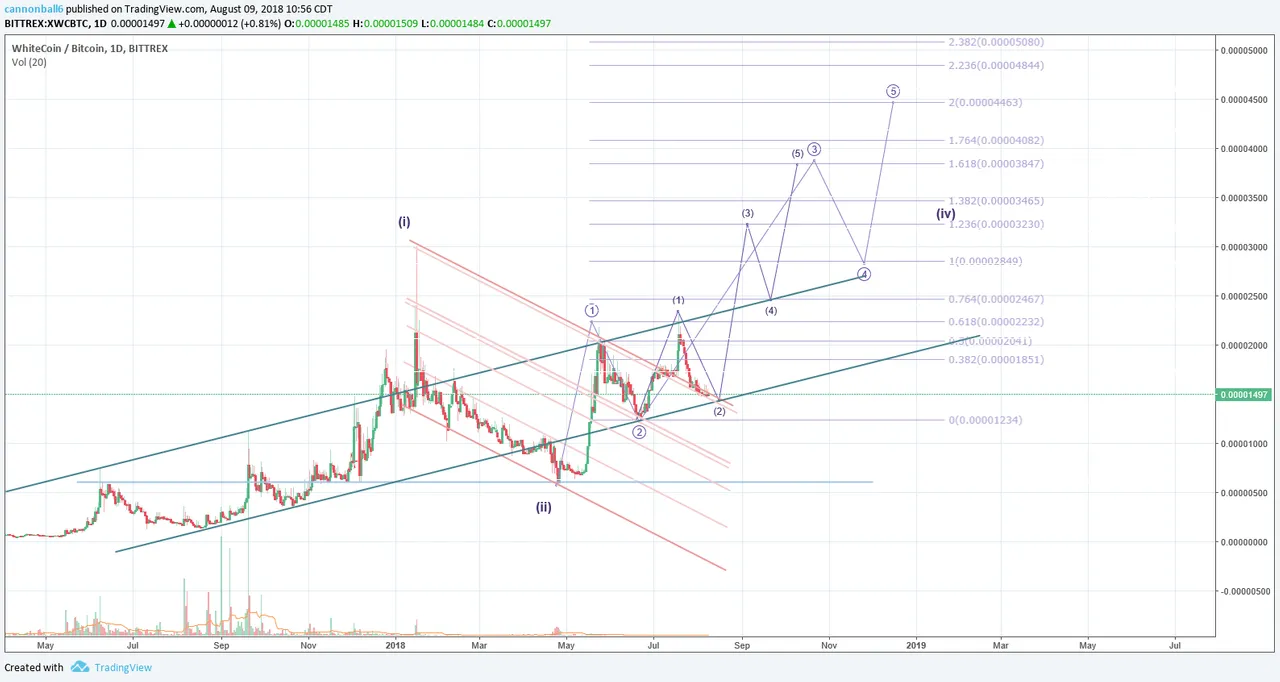
So what does that mean? Well basically, even if BTC slides to new lows, there is reason to believe that XWC can maintain its bullish price movement. Compared to last time, it now looks like wave (2) may drop a little farther, to the bottom of the long term channel, but upside targets remain unchanged from last time.
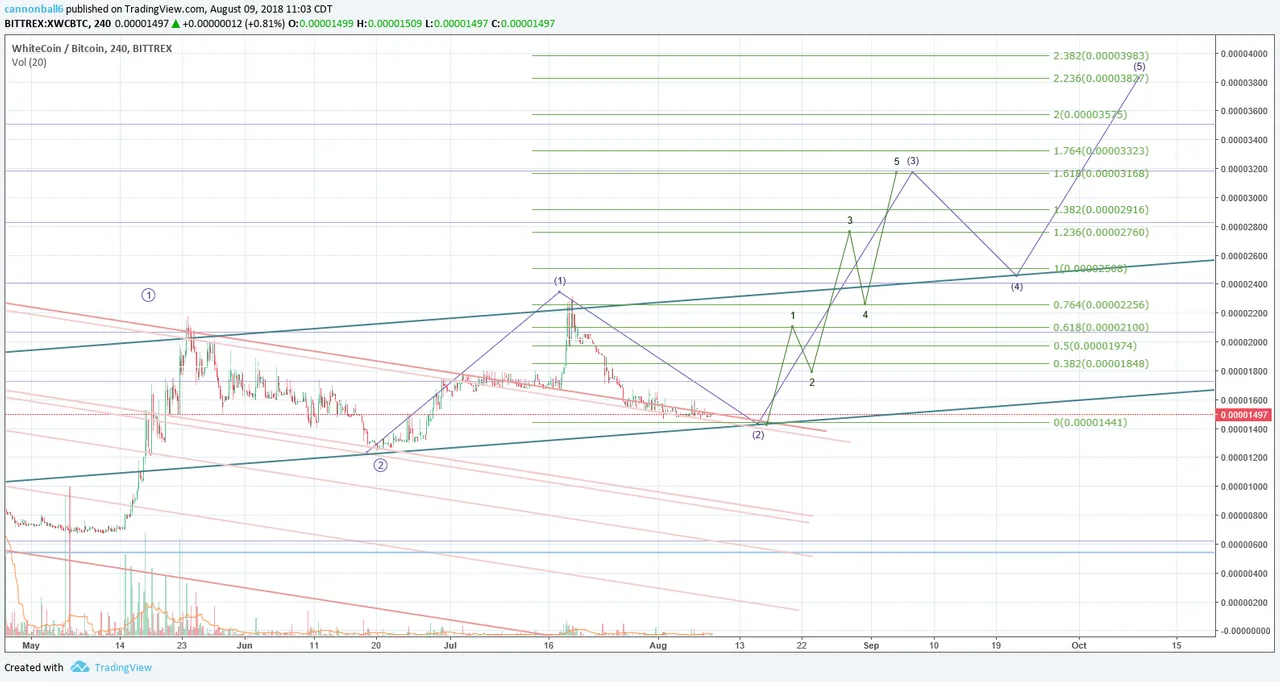
The following short term chart shows possible sub waves of wave (3), assuming that price first moves to the lower bound of the channel.
If you enjoyed this analysis, please consider an upvote, comment or resteem.