
What is Wave Theory?
The wave theory is a theory proposed by Elliot, and is therefore also known as Elliott's wave theory, which argues that the market trend repeats a pattern consisting of five rising waves and three falling waves.
What is Dow Theory?
Dow theory refers to the appearance of retracements in a trend due to certain conditions. The market is usually not going in a straight line, and there will always be some fluctuations. This retracement may be as strong as 2/3, 1 /2 or 1/3 of the previous increase/decrease in the market. In a rising market, after three wave rises there are usually two falling waves in the subsequent market.
Wave theory in the upward trend
A bullish trend refers to the successive breaking through of the high points after a reversal in the market, and in which the next low point is higher than the previous low point. This is a typical upward trend. As shown in the figure below, this kind of market appears as an indication that there are an increasing demand for the asset with more buy orders then sell orders.
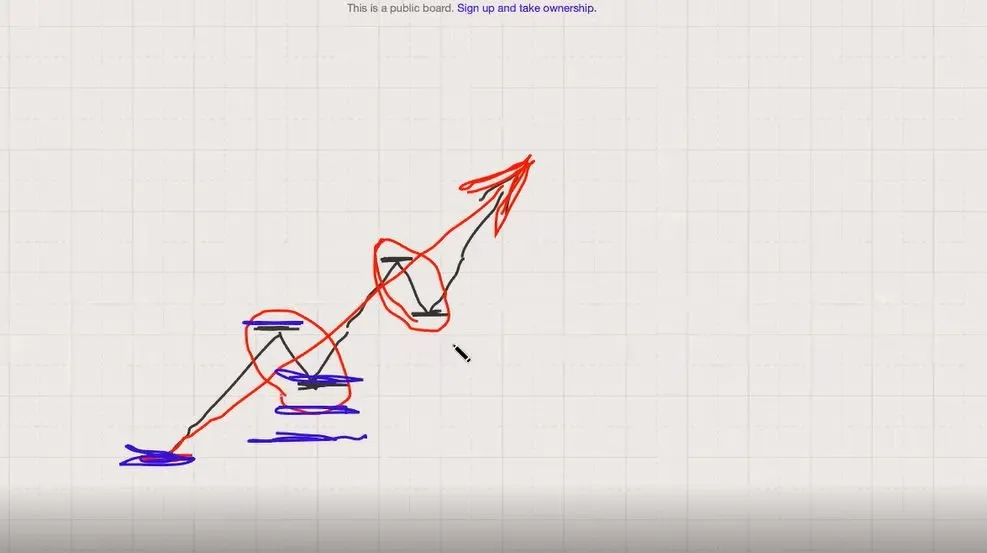
Combined with the wave theory and the Dow theory, the market in the picture will inevitably have a retracement. The expected magnitude of the retracement is about one-third or one-half of the overall increase. All in all, if a market rebounds and the previous high is exceeded, it indicates that an upward trend is coming soon, and you can try to enter the market.

Fibonacci retracement
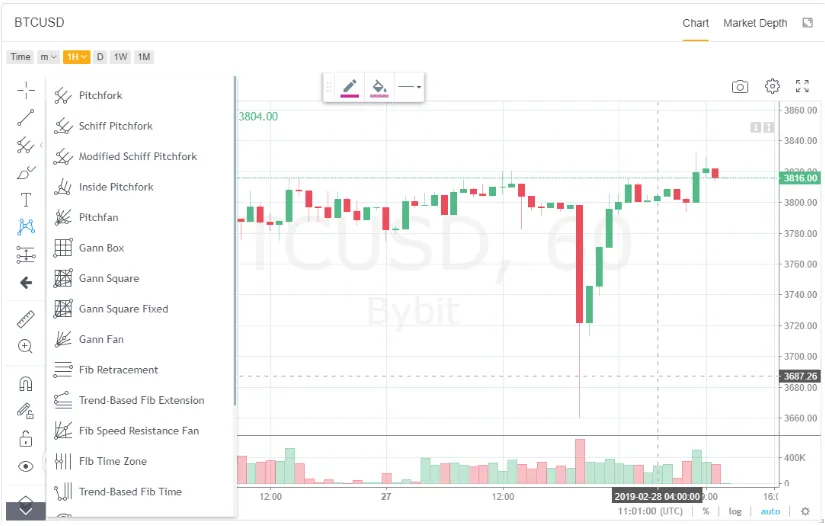
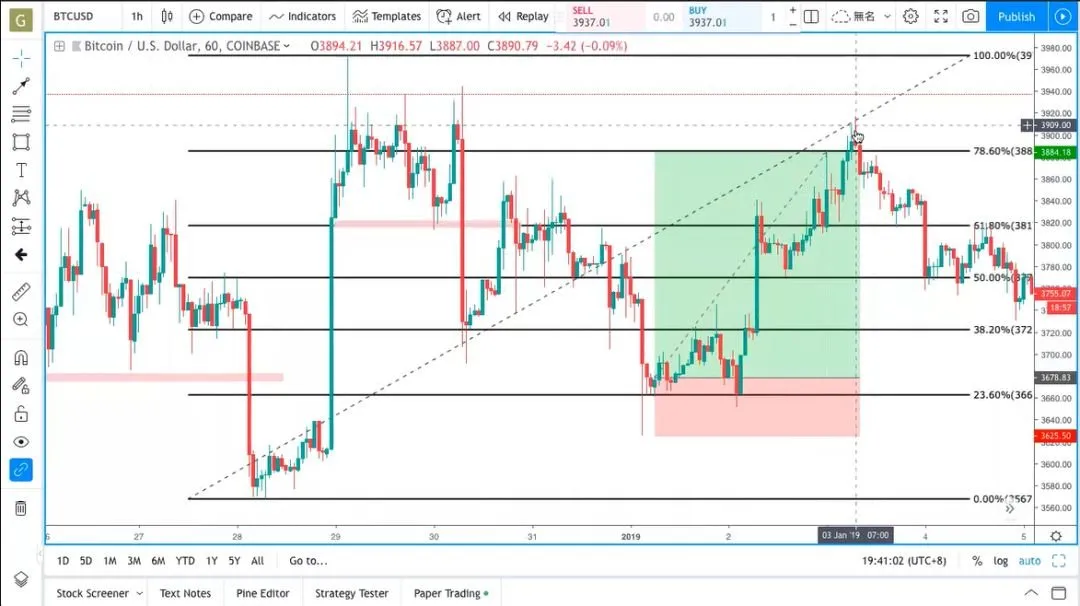
The Fibonacci retracement tool, as shown below on the Trading page of Bybit, is a practical tool for market analysis. Zoom out to see a all the candles in your selected area. On the left toolbar, select the Fibonacci retracement to analyze the retracement of said specified interval.
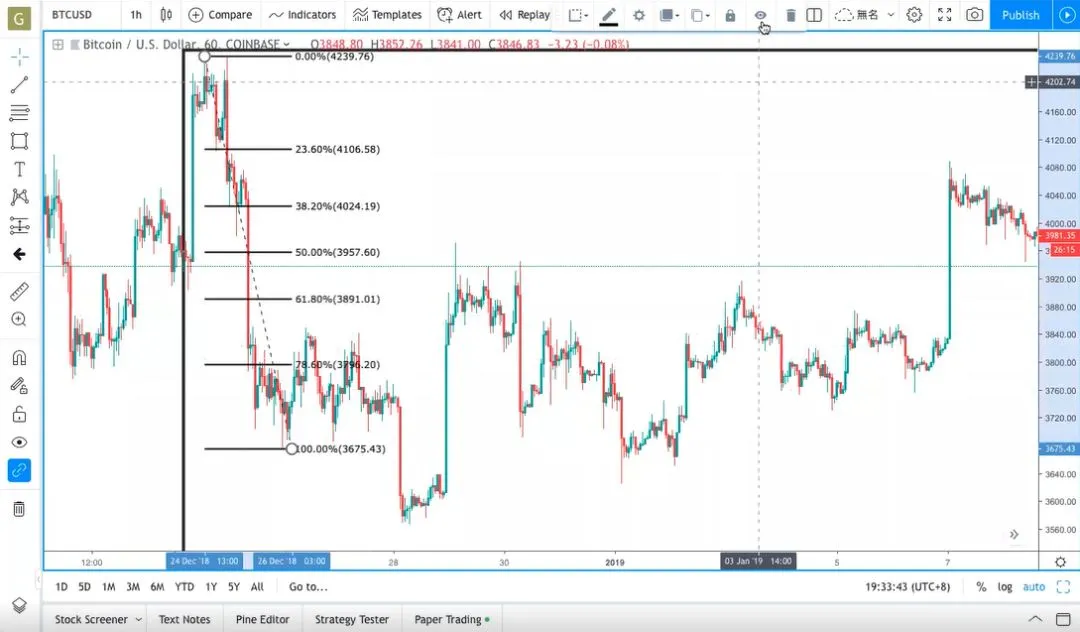
In the selected area below, after the market experienced three rising waves, the market outlook showed two rounds of adjustment, before having a new rising market. The key points to be noted are 78.6%, 61.8%, 50.0%, and 38.2%, of which 61.8% are in the third-half, and 50.0% is one-half, and 38.2% to 23.6%. The interval is two-thirds. If in the following market, the price rebounds to 61.8% and then rebounds, then continue to fall, you can consider shorting.
Firm explanation
01
In the market below, when the price is back by 61.8%, Dow's theory can be used here to determine what to do next. It is recommended that the price starts after the return of more than one-third. In the area shown in the figure, the price backstop does not exceed one-third and enters the downtrend. It is not recommended to enter the order in this interval.

02
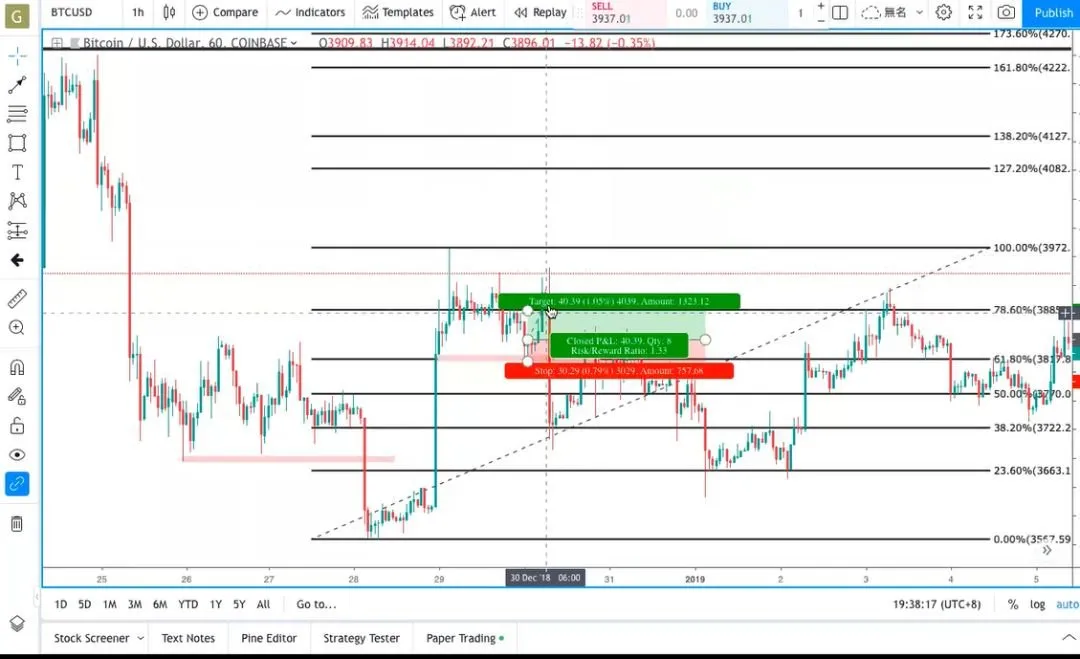
In the chart below, the market has had a retracement of more than one-third, breaking through the Fibonacci range, and the market has stabilized up after the retracement. At this time, you can enter the market to make orders. The Stop-Loss can be set at a more conservative point, the profit-and-loss ratio is set to 1:1.33, and if 10 Bitcoin is used as margin, the amount received after exiting the trade would be 13.3 Bitcoin.
03
The market price in the illustrated area fell by around 35%. If you choose to enter the market at this time, the Take-Profit can be preset to the position before the breakout is 3884.18, and the Stop-Loss is set to the front low of 3625.9.
How to define and find waves
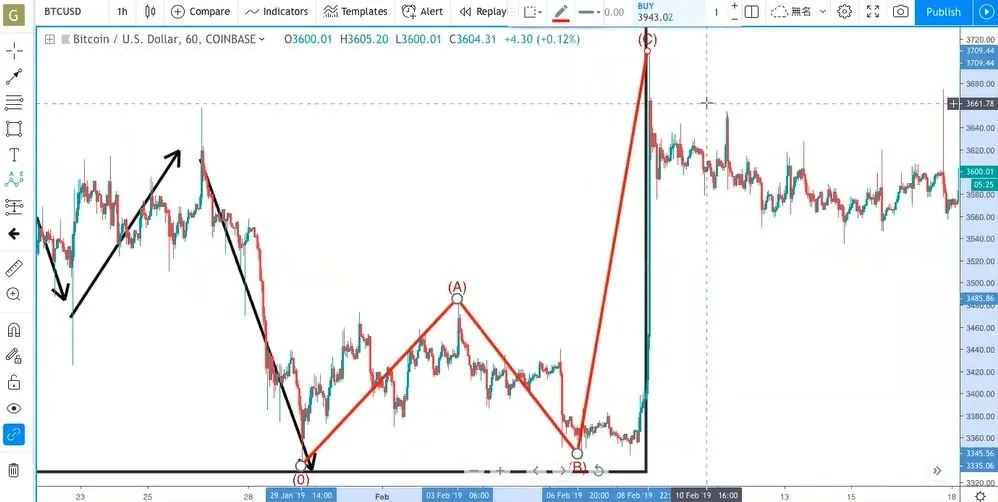
The price volatility, for example, due to shocking news, is called a wave, and the small retracement that appears later is also called a wave. As shown in the figure, the interval with a large amplitude is the initial starting wave, and the smaller one is the retracement, or correction, wave. Usually, three waves in one direction will be followed by two waves going in the opposite direction as a correction of the over-sentiment.
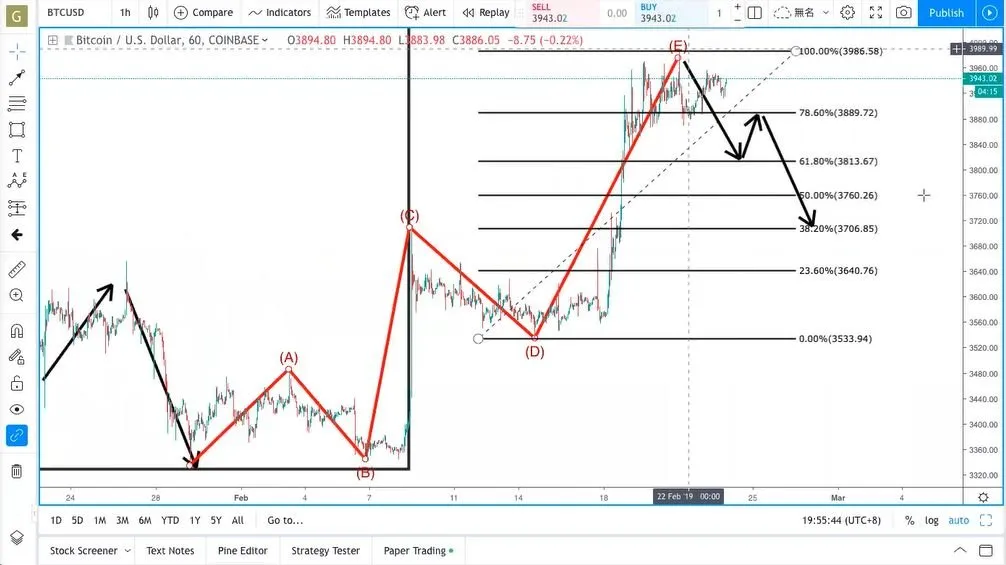
As shown in the figure, if the price breaks through point E in the subsequent development, the price will continue to rise. If the price is adjusted back and the retracement is below 61.8%, the market will continue to decline. Please note that waves and waves are a common trend in market development. If the amplitude does not exceed 61.8%, it is very likely that there will be a backlash. Only when the callback is more than one-third, can it be called a successful callback.
Where to Find Us:
Website: https://www.bybit.com
Twitter: https://www.twitter.com/Bybit_Official
Reddit: https://www.reddit.com/r/Bybit/
Youtube: https://bit.ly/2Cmuibg
Medium: https://medium.com/bybit
Facebook: https://bit.ly/2S1cyrf
Linkedin: https://bit.ly/2CxHGcz
Instagram: https://www.instagram.com/bybit_official/
Telegram: https://t.me/BybitTradingChat