In this fourth study of the 2017 full year statistics for the steem blockchain platforms I will look at the figures for Steepshot.
Steepshot describes itself as “A platform that rewards people for sharing their lifestyle and visual experience.” It’s a similar concept to Instagram but, rather than being internet-based, it’s a decentralised, Steem blockchain based application, with the additional benefit of the built-in rewards system that forms a part of all Steem platforms.
The concept was originally presented at SteemFest 2016 by co-founder Pavel Martynov (@pmartynov) and the earliest test version was launched in early 2017. However it is only in the second half of 2017, and over the last two months in particular, that use of the application and rewards have really started to accelerate.
You can read more about the Steepshot application under the @steepshot user account.
There are four parts to the analysis:
Overview of 2017: An overview of the figures for the full year 2017 (daily individual author numbers, post numbers and reward payouts) in particular illustrating the rapid growth in the platform over the last two months of the year;
Top 50 users: A summary of the payouts for the top 50 users over 2017 showing those users that have had most financial success through the platform;
Top Tags: A summary of the payouts for the top tags with the aim of illustrating which types of photographs perform well on the application; and
Analysis of December Growth: An analysis of the growth over the full month of December to illustrate what is driving the rapid acceleration in users, post numbers and post payouts.
Outline
- Scope of Analysis
- Tools Used
- Overview of 2017
- Top 50 users and Top Tags
- Analysis of December Growth
- Scripts
1 Scope of Analysis
The analysis is based on the data for the Steepshot application obtained through SQL queries of SteemSQL, a publicly available Microsoft SQL database containing all the Steem blockchain data.
The Steepshot data has been filtered from the overall steem blockchain data by use of the app label information in the json_metadata column of the Comments table. One limitation of this approach is that modifying an article in another application causes the app label information in the json_metadata column to change to that of the modifying platform. However it is expected that this limitation has minimal effect.
The analysis focuses on articles posted in 2017, with the last section using data from November and December only. The data has been filtered by date using the timestamps in the created column of the Comments table.
Tag information has been obtained from the tag label information in the json_metadata column of the Comments table. The tags Steepshot, photography and photo were filtered out once the data had been extracted.
2 Tools Used
Valentina Studio, a free data management tool, was used to run the SQL queries. The raw data was then verified and analysed in the spreadsheet application of the LibreOffice office suite.
Graphs and charts were produced using Numbers, the Mac spreadsheet tool, or using RAWGraphs, an open source data visualisation framework.
SQL scripts are included at the end of this analysis.
3 Overview of 2017
As noted above, Steepshot was originally presented at SteemFest 2016 and the earliest test version was launched in early 2017. However it is only in the second half of 2017, and over the last two months in particular, that use of the application and rewards have really started to accelerate. In December it was the fourth largest application on the steem blockchain ranked by numbers of regular posters, sixth ranked by number of posts, and seventh ranked by total post payout.
The chart below covers the full year of 2017 for the Steepshot platform:
- The light blue line is the number of articles (i.e. photos) per day and the dark blue line is number of distinct posters. These are plotted against the left hand axis.
- The silver columns are author rewards and the gold columns are curator rewards. These are plotted against the right hand axis.
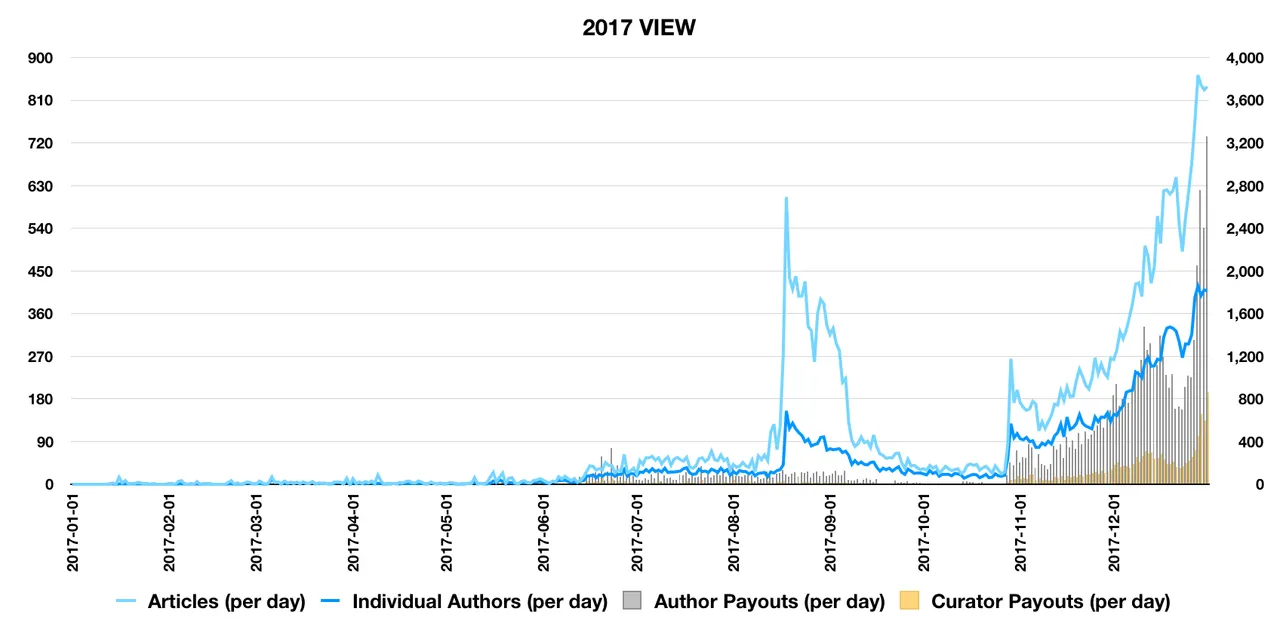
The chart illustrates a first significant surge of usage in August, following a number of developments including the release of the iOS application (to complement the already existing Android application) and the development of the steepshot.io landing page.
A second surge at the end of October followed the release of the (open source) web application. This latter increase brought an increase in post payouts as well as swiftly rising author and photo numbers (although it is noted that the growth in rewards was assisted by the rise in the steem price over December, from US$1 to US$3).
The table of monthly figures for Steepshot summarises the overall results by month.
| Month | All Posters | Regular Posters | All Posts | Total Payouts |
|---|---|---|---|---|
| Jan | 1 | 1 | 46 | 0 |
| Feb | 3 | 2 | 54 | 0 |
| Mar | 35 | 10 | 116 | 66 |
| Apr | 17 | 7 | 124 | 6 |
| May | 34 | 8 | 205 | 92 |
| Jun | 148 | 46 | 691 | 2,427 |
| Jul | 244 | 92 | 1,544 | 2,830 |
| Aug | 467 | 250 | 6,740 | 3,345 |
| Sep | 274 | 136 | 3,291 | 1,474 |
| Oct | 371 | 106 | 1,604 | 1,332 |
| Nov | 727 | 348 | 5,724 | 13,470 |
| Dec | 1,713 | 890 | 16,571 | 46,286 |
| Total | 36,710 | 71,330 |
Note that Total Payouts exclude the beneficiaries share (10% of author payouts)
The December figures show over a 150% increase in regular author and photo (posts) numbers and almost a 250% increase in total payouts.
Looking to 2018 Steemshot have ambitious plans to expand outside of the existing Steem community. Combined with the rising Steem price in January and increased interest from social media stars arriving from existing internet platforms, I would expect to see the above metrics continue to increase.
Top 50 Users and Top Tags
The second and third parts of the analysis, Top 50 Users and Top Tags are included together in this section.
My initial idea for this part of the study aimed to look at the main photo tags of the top users to illustrate the themes and types of photos that they were sharing. However the results were inconclusive, with a number of the top authors not providing additional tags outside of Steepshot and photography.
Instead I separated the two analyses. The two sunburst charts below (one inside the other) show:
- The top 50 users by author payout for the full year 2017; and
- The top tags, again measured by author payout, over 2017.
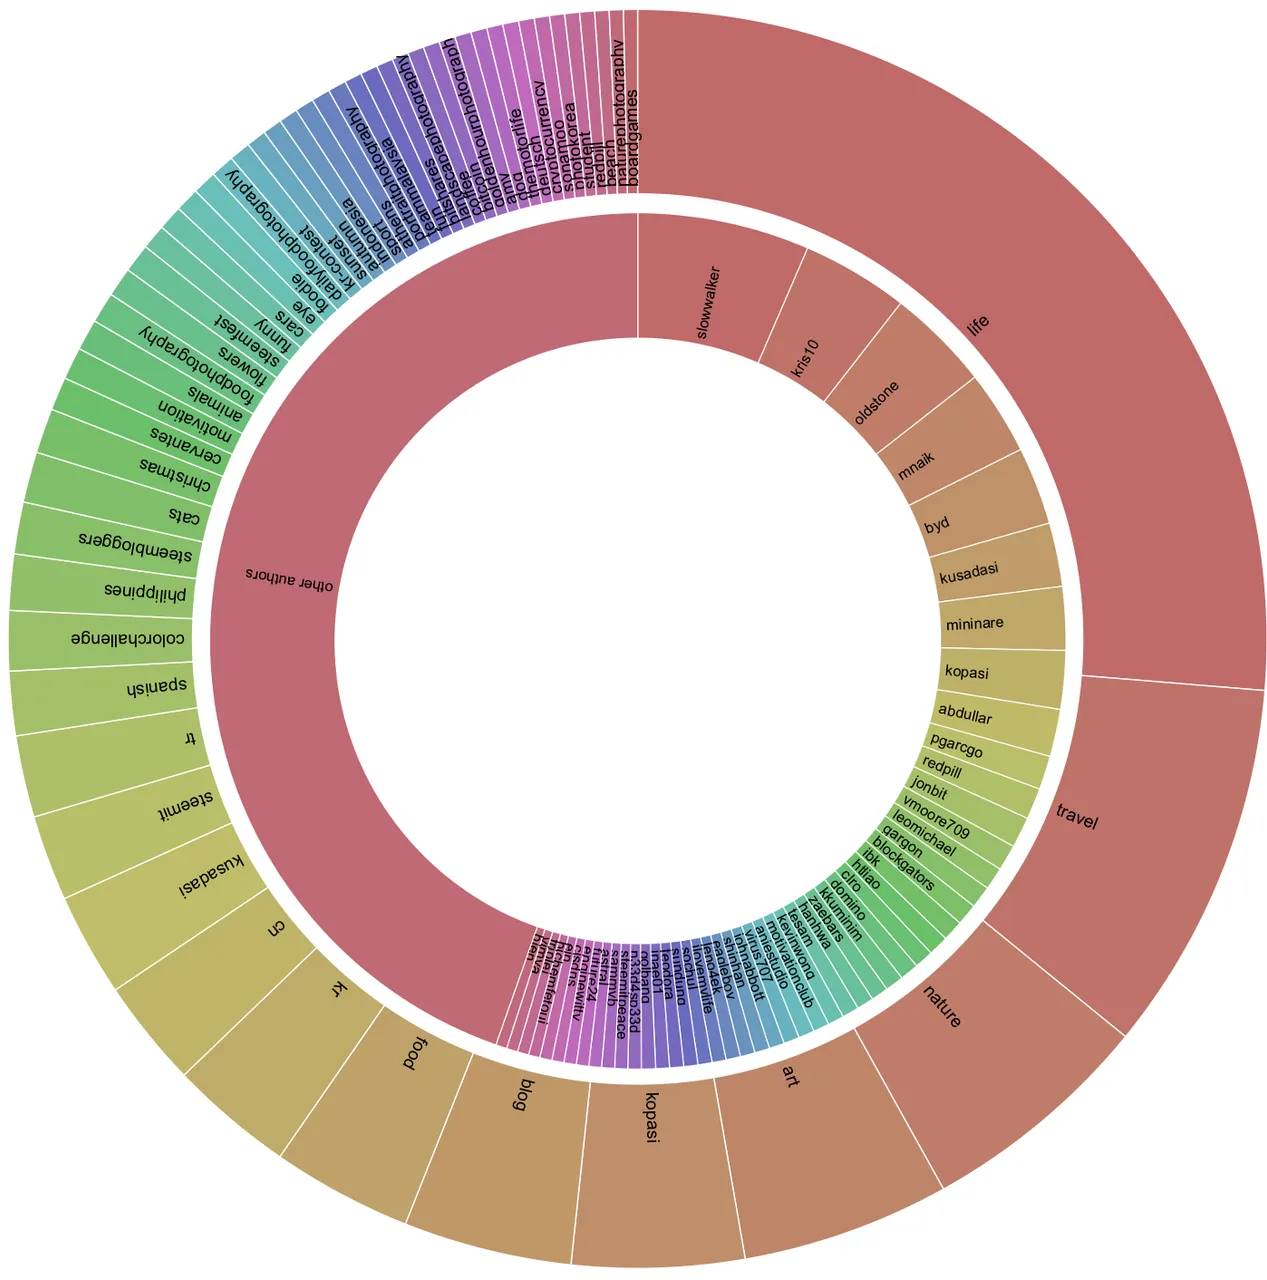
Congratulations to @slowwalker, @kris10, @oldstone, @mnaik, and @byd for being the top 5 rewarded authors over 2017.
It is also noticeable that the top 50 users share more author rewards than all the remaining users of the platform combined.
For the top tags I obtained the first tag that was not Steepshot, photography, or photo.
The top tags over 2017 (excluding specific user names) were life, travel, nature, art, blog and food. Korea, China, and Turkey were the top country tags. Cats won the popularity battle over dogs, while flowers, cars and sunsets were also popular.
5 Analysis of December Growth
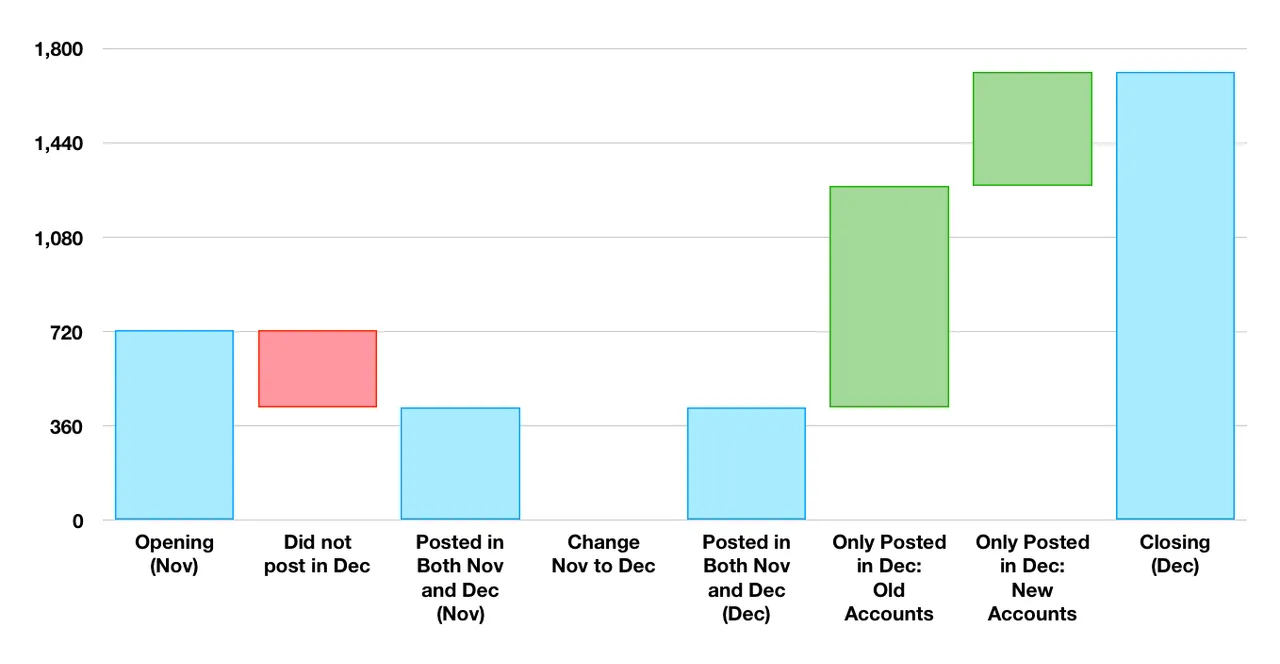
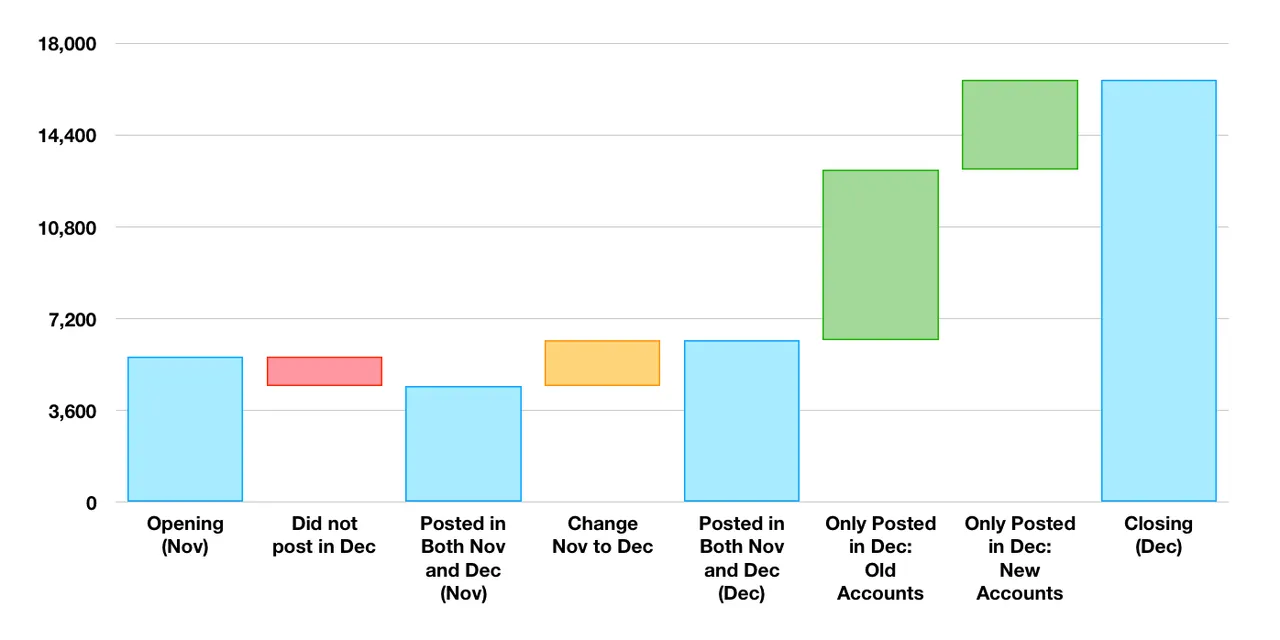
Finally, a look at the waterfall charts to give an indication of what is driving the growth over the full month of December:
Individual author numbers:
Numbers of posts:
Rewards (total author and curator rewards):
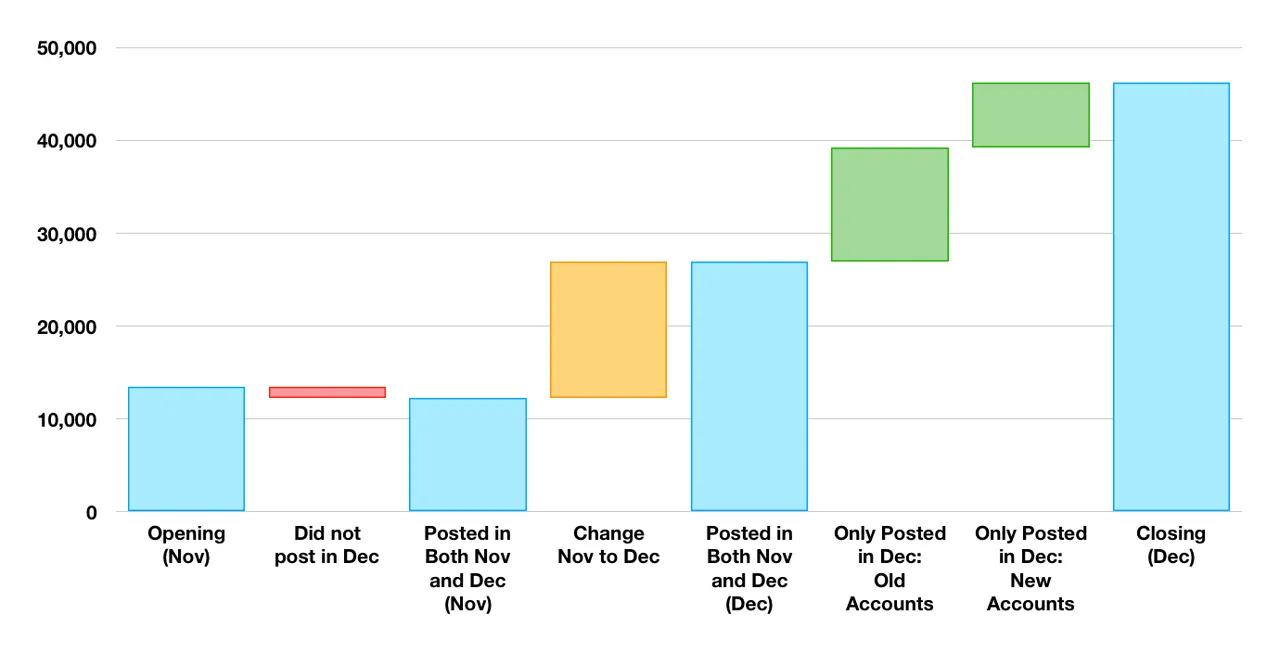
What do the waterfalls tell us about the growth over December:
Red: 59% of users who posted a photo in November also did so in December. This is an improvement in comparison to the average statistic for the blockchain platforms of 54%. The users who did not return were responsible for adding 20% of photos in November and captured only 9% of overall rewards. This suggest these may have been users who were testing out the application rather than committed photo lifestyle documenters.
Amber: The consistent central core of users increased activity (i.e. number of photos added) by 31% between November and December but benefited from a doubling in overall rewards, largely due to the rising steem price.
Green: Aside from the rising steem price (see amber post rewards) the main driver for growth from November to December was from existing user accounts (i.e. accounts created prior to November) posting to the platform in December but not in November. There was also a significant volume of new accounts signed up to use the platform. Both of the categories of new users gained sizeable chunks of the overall rewards
6 Scripts
This was the main form of the scripts used for the analysis.
/* SINGLE APP ANALYSIS by AUTHOR and MONTH - 2017 Full year */
SELECT
    Comments.author,
    Month(Comments.created) as [CommentMonth],
    IIF(isjson(comments.json_metadata) = 1, IIF(CHARINDEX('/', json_value(comments.json_metadata, '$.app')) > 0, SUBSTRING(json_value(comments.json_metadata, '$.app'), 1, CHARINDEX('/', json_value(comments.json_metadata, '$.app'))-1),json_value(comments.json_metadata, '$.app')), null) as [Application],
    Count(Comments.author) AS [Posts],
    Count(distinct Comments.author) AS [DistinctCommentAuthor],
    count(Comments.parent_author) AS [ParentAuthor],
    count(distinct Comments.parent_author) AS [DistinctParentAuthor],
    sum(CONVERT(REAL,Comments.pending_payout_value)) AS [PendingPayoutValue],
    sum(CONVERT(REAL,Comments.curator_payout_value)) AS [CuratorPayoutValue],
    sum(CONVERT(REAL,Comments.total_payout_value)) AS [TotalPayoutValue]
FROM
    Comments (NOLOCK)
WHERE
    YEAR(Comments.created) = 2017 AND
    depth = 0 AND
    IIF(isjson(comments.json_metadata) = 1, IIF(CHARINDEX('/', json_value(comments.json_metadata, '$.app')) > 0, SUBSTRING(json_value(comments.json_metadata, '$.app'), 1, CHARINDEX('/', json_value(comments.json_metadata, '$.app'))-1),json_value(comments.json_metadata, '$.app')), null) = 'steepshot'
GROUP BY
    Comments.author,
Month(Comments.created) as [CommentMonth]
    IIF(isjson(comments.json_metadata) = 1, IIF(CHARINDEX('/', json_value(comments.json_metadata, '$.app')) > 0, SUBSTRING(json_value(comments.json_metadata, '$.app'), 1, CHARINDEX('/', json_value(comments.json_metadata, '$.app'))-1),json_value(comments.json_metadata, '$.app')), null)
Very similar scripts were used for the extraction of data by day and for the Top 50 tag analysis. Briefly the small differences were:
- Changing from grouping by the month of the comment creation date to the exact date of comment creation allows the extraction by individual date. The author information is not required for this run (and the results would be very large by author and date)
- Use of the
taglabel information from thejson_metadatacolumn of theCommentstable for extraction and grouping in place of the month.
That's all for today. Thanks for reading!
Posted on Utopian.io - Rewarding Open Source Contributors