In this second study of the 2018 January statistics for the Steem blockchain platforms I will look at the figures for busy.org.
Busy.org is a social network platform that interfaces with the Steem blockchain. The platform showed substantial growth in user metrics over the last three months of 2017, rising to be the second ranked Steem platform by payouts and third ranked by post numbers and regular user numbers by the end of the year. My January analysis of the “Market Share of the Steem Blockchain by Application” showed that the busy.org metrics for January 2018 were also very positive. This analysis looks in more detail at this growth and the statistics for busy.org over January 2018.
There are three parts to the analysis:
Overview of January 2018: An overview of the figures for January 2018 (daily individual author numbers, post numbers and reward payouts);
Analysis of Growth: A breakdown of the growth in key metrics from December 2017 to January 2018.
Top 50 Users: A summary of the payouts for the top 50 users over January 2018 showing those users that have had most financial success through the platform and the main tags under which they post.
0 Summary of Findings
I start by presenting a high level summary of findings for readers who have limited available time. The full details of the analysis are included in the later sections of this article.
0.1 Overview of January 2018
An in the three preceding months, busy.org showed substantial growth in user metrics over January 2018.
The chart below covers the last three months: November 2017 - January 2018 for the platform:
- The light blue line is the number of articles per day and the dark blue line is number of distinct authors. These are plotted against the left hand axis.
- The silver columns are author rewards and the gold columns are curator rewards. These are plotted against the right hand axis.
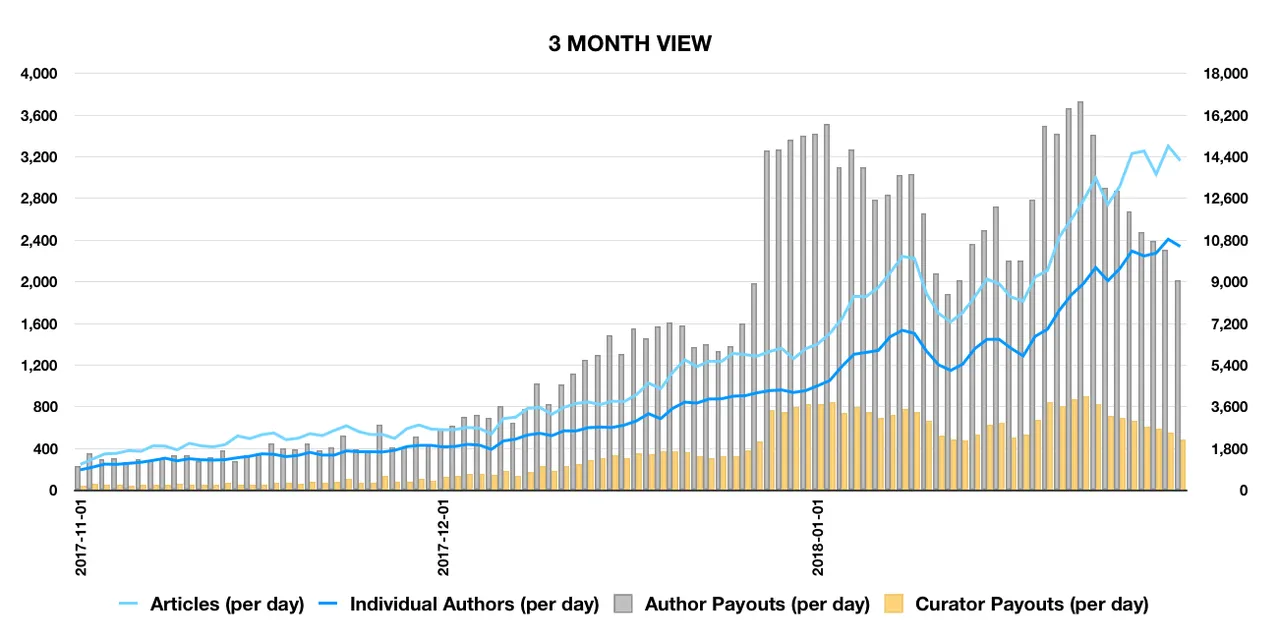
Individual author numbers per day rose 140%, from around 900 at the end of December to 2,200 at the end of January.
The number of articles per day (not comments) increased at a similar speed, 1,300 articles became 3,100 over the course of the month.
Post payouts increased close to 100% month on month (taking the totals for each month as a whole) although the payouts in any particular week rose and fell, following the volatile movements in the Steem price (and crypto in general) across January.
Further analysis of these growth figures are included in the next section.
The table of figures below summarises the overall results for each month since the start of 2017:
| Month | All Posters | Regular Posters | All Posts | Total Payouts |
|---|---|---|---|---|
| Jan 17 | 8 | 2 | 24 | 22 |
| Feb 17 | 49 | 9 | 98 | 296 |
| Mar 17 | 31 | 8 | 75 | 126 |
| Apr 17 | 25 | 3 | 51 | 44 |
| May 17 | 50 | 5 | 109 | 242 |
| Jun 17 | 64 | 10 | 165 | 724 |
| Jul 17 | 117 | 32 | 1223 | 1,024 |
| Aug 17 | 64 | 10 | 169 | 288 |
| Sep 17 | 126 | 34 | 472 | 2,555 |
| Oct 17 | 937 | 307 | 4124 | 23,968 |
| Nov 17 | 1,367 | 747 | 14,266 | 59,900 |
| Dec 17 | 2,672 | 1,579 | 29,790 | 25,0011 |
| Jan 18 | 7,409 | 3,959 | 69,833 | 486,425 |
| Total | 120,399 | 825,624 |
Looking forward to February I would expect the strong growth in busy.org metrics to continue. However its rankings may come under challenge by DTube following the substantial additional delegation made to DTube from the central @steemit account at the start of February.
0.2 Analysis of Growth
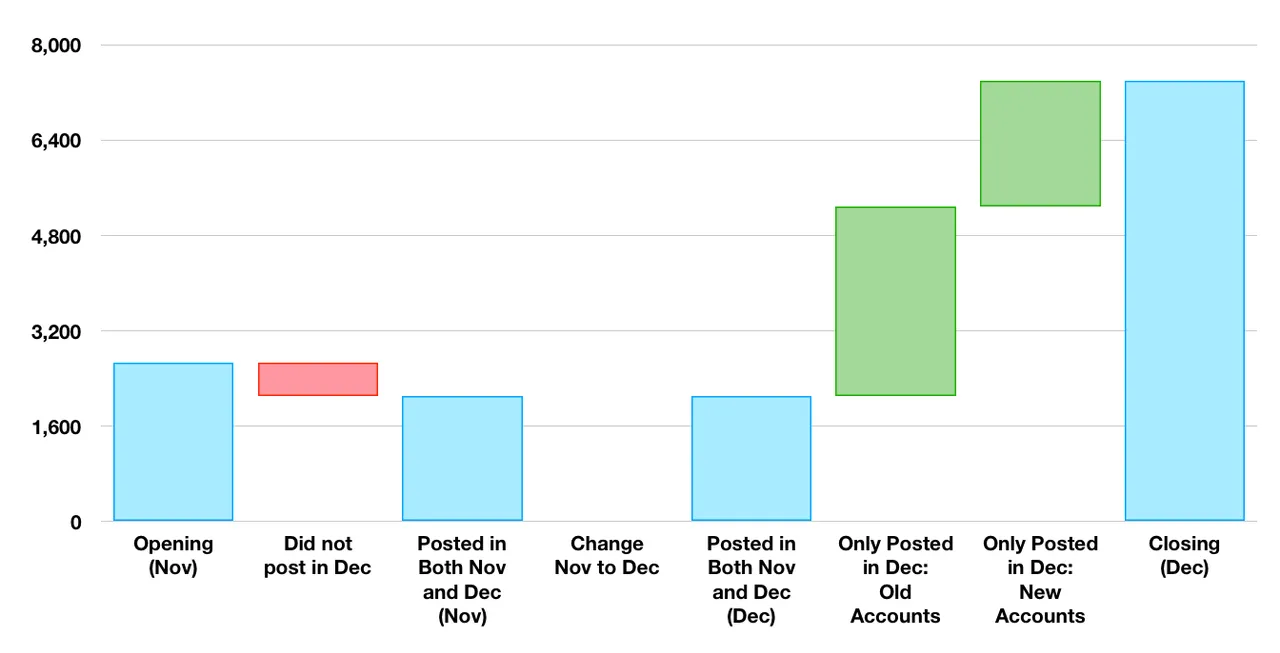
This section focuses on the growth in busy.org metrics between December and January. The following waterfalls break this growth down into its constituent parts.
- The left hand blue column shows the total numbers for December: the total number of individual users, the total number of posts (not comments) and the total amount of rewards generated by posting on the steemit.com platform.
- The right hand column shows the same numbers but for Janaury.
The waterfall takes us from the December to January figures, with various pit-stops along the way. The blue columns are balances, the red, amber, and green floats are movements to get to those balances.
It’s useful to consider the picture as a whole, so I’ll post the charts first and then draw conclusions.
Individual Authors (all authors, not just regular)
Post Numbers (not comments)
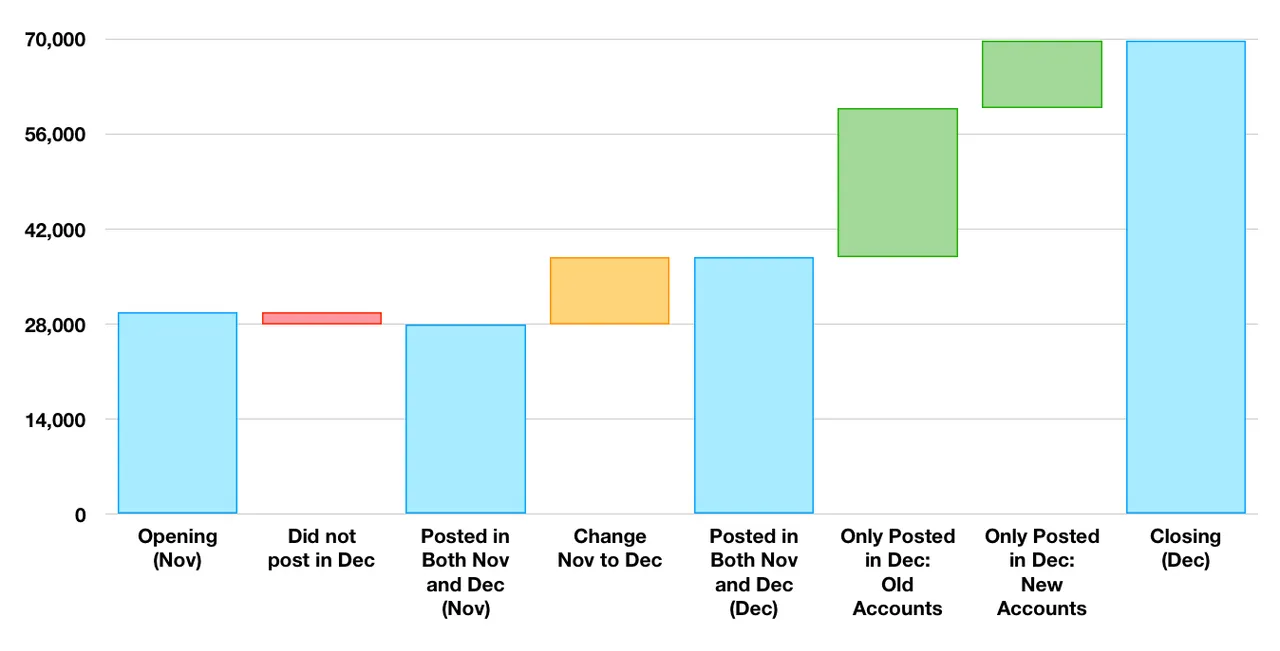
Post Payouts (author and curator combined)

The waterfalls tell a clear story of the growth over the last month.
Red float - User loss: Only 21% of users from December did not post again on busy.org in January. As in December (when the corresponding figure was 27%) busy.org has the lowest percentage user loss across all Steem platforms. It is also noticeable that these users represented a small proportion of posts generated and rewards (6% and 4% losses respectively).
Amber float - Increased production from existing users: Existing busy.org users from December increased their production by 33% on the platform between December and January, as measured by post numbers; a broadly comparable figure to that of 46% for last month. Their rewards increased by 55% (just above the 48% seen on steemit.com). The majority of this increase comes from the rise in the Steem price over January.
Green floats - Overall the number of authors in January increased by over 175% from that in December. The majority of additional authors were accounts created prior to the start of January (so could be considered to be users transitioning across to the platform). However there were also a sizeable number of users with accounts created in January, illustrating that new users to the blockchain are finding their way across to the alternative platform quickly. As might be expected, newer users obtained a smaller proportion of rewards than older existing accounts.
0.3 Top 50 Users
As a final analysis I look at the Top Users of the busy.org platform for January 2018, as measured by author payout.
It is worth noting that there are a couple of limitations to this analysis:
- Some author payouts will have been augmented by votes from upvote bots. As such the net earnings will be lower than those seen here.
- The amounts are expressed as per the payout values shown on steem platform sites - no conversion has been made to US$ or to Steem. The value of payouts can actually differ quite substantially from one month to the next, depending on the value of the underlying currencies.
The sunburst chart illustrates the Top User payouts generated from the busy.org platform as measured over January 2018. A further layer of breakdown - the main tags under which they post - has been added.
(“various” is typically seen where posters use a wide variety of main tags).
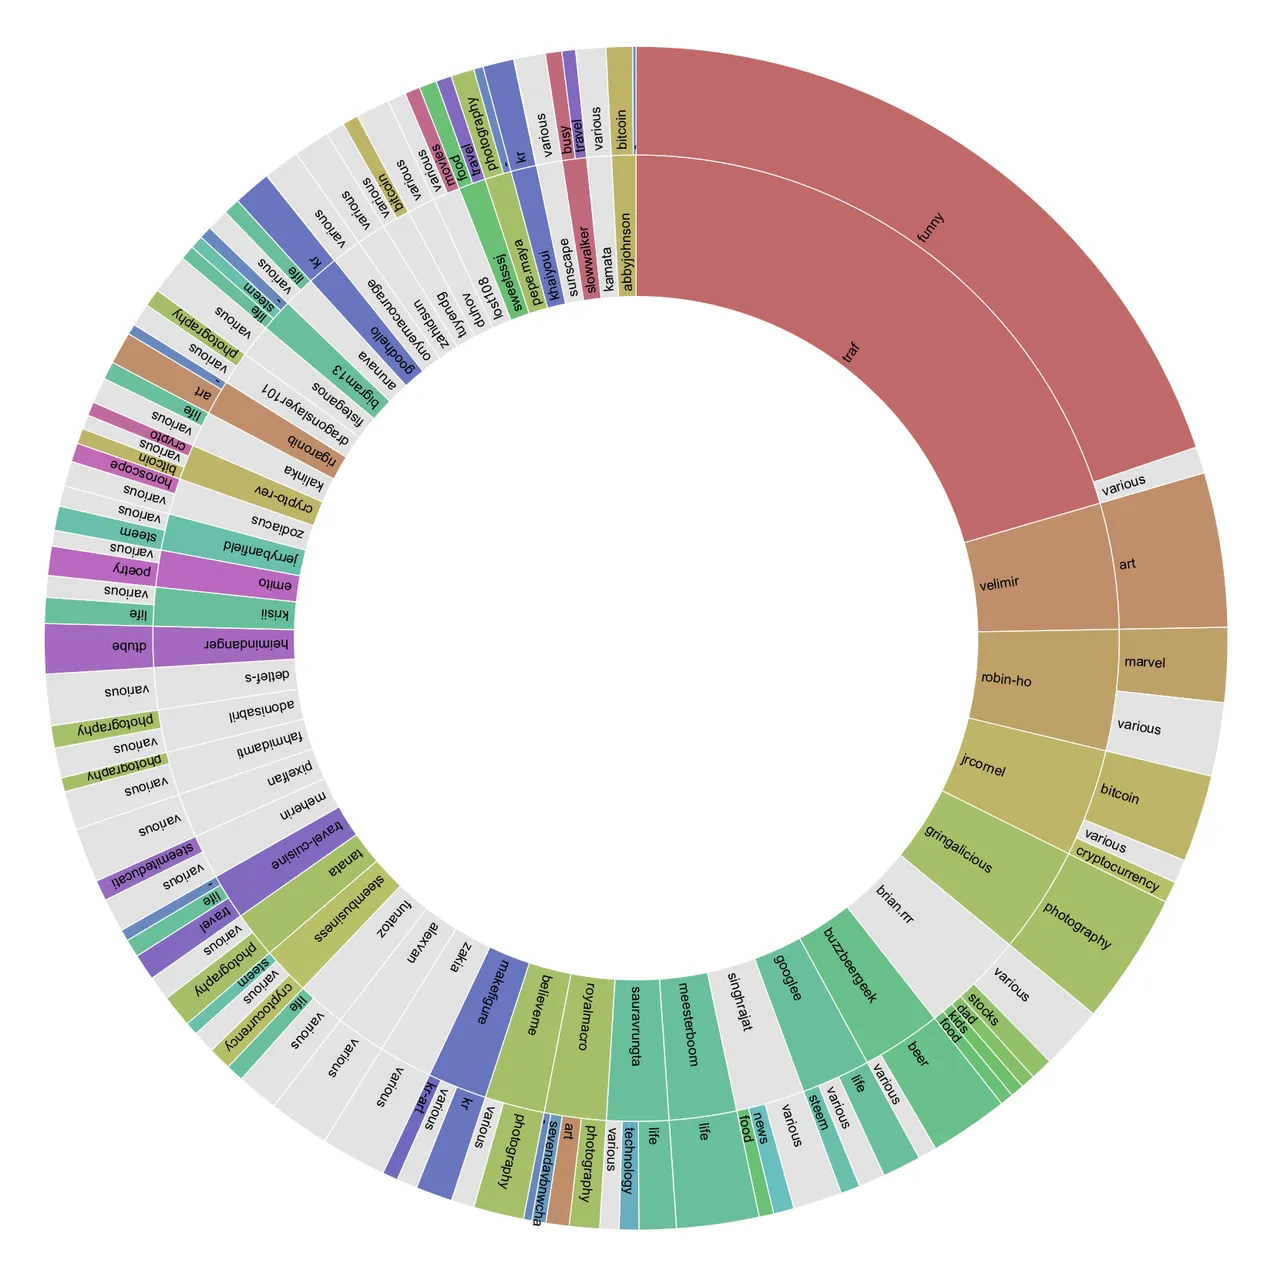
A few highlights:
These top 50 authors represent 0.7% of all posters over January 2018 and earned just under 37% of all author payouts from the platform.
@traf and @velimir retain the top two spots from December 2017, whilst @robin-ho is the biggest climber, up from 8th to 3rd for January. @googlee and @singhrajat are new names in the top 10 users on busy.org.
“funny” became there highest rated first tag in January 2018, with photography, life, busy and kr making up the top 5. “steemit” was the only new tag in the top 10.
Outline
- 0 Summary of Findings and Conclusions (see above)
- 0.1 Overview of January 2018
- 0.2 Analysis of Growth
- 0.3 Top 50 Users
- 1 Scope of Analysis
- 2 Tools Used
- 3 Scripts
1 Scope of Analysis
The analysis is based on the data for the busy.org platform obtained through SQL queries of SteemSQL, a publicly available Microsoft SQL database built and maintained by @arcange, containing all the Steem blockchain data.
The busy.org data has been filtered from the overall steem blockchain by use of the app label information in the json_metadata column of the Comments table. One limitation of this approach is that modifying an article in another application causes the app label information in the json_metadata column to change to that of the modifying platform. A recent analysis based on the Utopian platform data suggests that this limitation may have an impact of around 5% (although I would expect this impact to be smaller for busy.org data).
The analysis focuses on articles posted in January 2018. The data has been filtered by date using the timestamps in the created column of the Comments table.
Tag information has been obtained from the tag label information in the json_metadata column of the Comments table.
2 Tools Used
Valentina Studio, a free data management tool, was used to run the SQL queries. The raw data was then verified and analysed in the spreadsheet application of the LibreOffice office suite.
Graphs and charts were produced using Numbers, the Mac spreadsheet tool, or using RAWGraphs, an open source data visualisation framework.
SQL scripts are included in the next section.
3 Scripts
This was the main script used for the analysis.
/* SINGLE APP ANALYSIS by AUTHOR and MONTH */
SELECT
    Comments.author,
    YEAR(Comments.created) AS [YEAR],
    MONTH(Comments.created) AS [MONTH],
    IIF(isjson(comments.json_metadata) = 1, IIF(CHARINDEX('/', json_value(comments.json_metadata, '$.app')) > 0, SUBSTRING(json_value(comments.json_metadata, '$.app'), 1, CHARINDEX('/', json_value(comments.json_metadata, '$.app'))-1),json_value(comments.json_metadata, '$.app')), null) as [Application],
    Count(Comments.author) AS [Posts],
    Count(distinct Comments.author) AS [DistinctCommentAuthor],
    count(Comments.parent_author) AS [ParentAuthor],
    count(distinct Comments.parent_author) AS [DistinctParentAuthor],
    sum(CONVERT(REAL,Comments.pending_payout_value)) AS [PendingPayoutValue],
    sum(CONVERT(REAL,Comments.curator_payout_value)) AS [CuratorPayoutValue],
    sum(CONVERT(REAL,Comments.total_payout_value)) AS [TotalPayoutValue]
FROM
    Comments (NOLOCK)
WHERE
    YEAR(Comments.created) = 2018 AND
    MONTH(Comments.created) = 1 AND
    depth = 0 AND
    IIF(isjson(comments.json_metadata) = 1, IIF(CHARINDEX('/', json_value(comments.json_metadata, '$.app')) > 0, SUBSTRING(json_value(comments.json_metadata, '$.app'), 1, CHARINDEX('/', json_value(comments.json_metadata, '$.app'))-1),json_value(comments.json_metadata, '$.app')), null) = 'busy'
GROUP BY
    Comments.author,
    YEAR(Comments.created),
    MONTH(Comments.created),
    IIF(isjson(comments.json_metadata) = 1, IIF(CHARINDEX('/', json_value(comments.json_metadata, '$.app')) > 0, SUBSTRING(json_value(comments.json_metadata, '$.app'), 1, CHARINDEX('/', json_value(comments.json_metadata, '$.app'))-1),json_value(comments.json_metadata, '$.app')), null)
Very similar scripts were used for the analysis by first tag and for the extraction of data by day. Briefly the small differences are:
- Changing from grouping by the month of the comment creation date to the exact date of comment creation allows the extraction by individual date. The author information is not required for this run (and the results would be very large by author and date)
- Use of
taglabel information for extraction and grouping in place of the year / month.
That's all for today. Thanks for reading!
Posted on Utopian.io - Rewarding Open Source Contributors