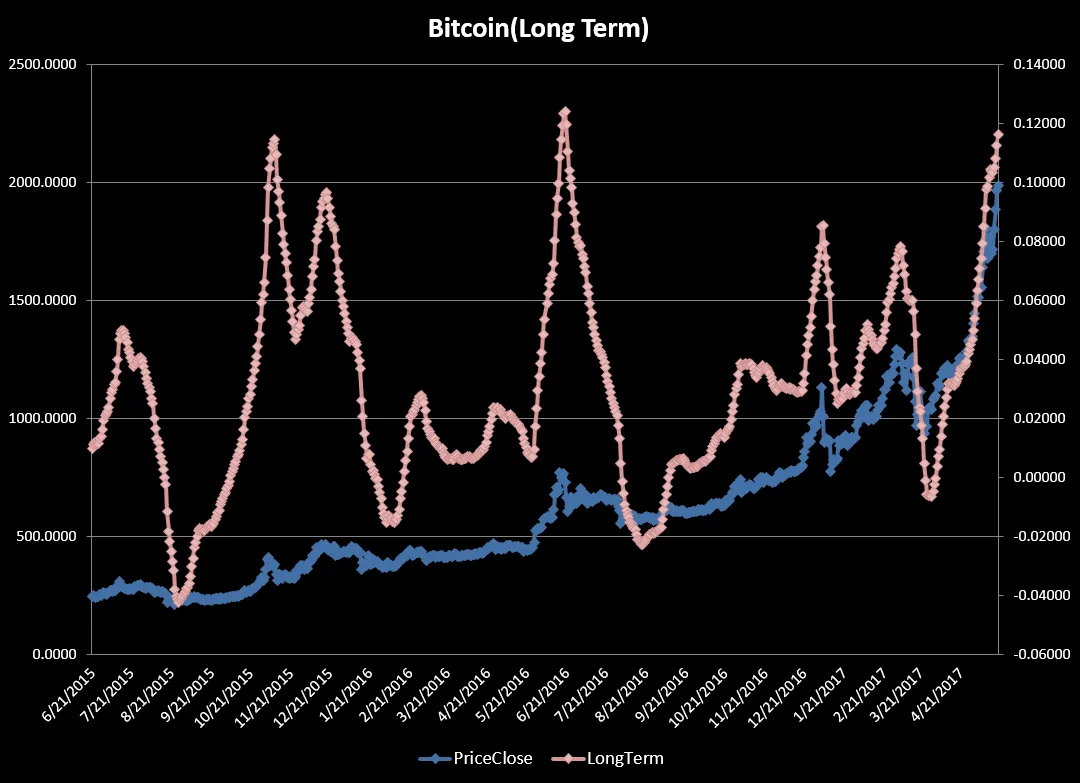
We have provided a 2 year chart of Bitcoin using our LT Oscillator and you can see the red dots have reached this level 2 other times and each time we saw a decline of between 20-30%. Last buy signal was given on 4/1/2017 and has gone up since then about 66% so risk to the reward no longer favors being long BTC at this time.
You can view previous signals at https://tradingbtc.com