QTUM has been under pressure as well.
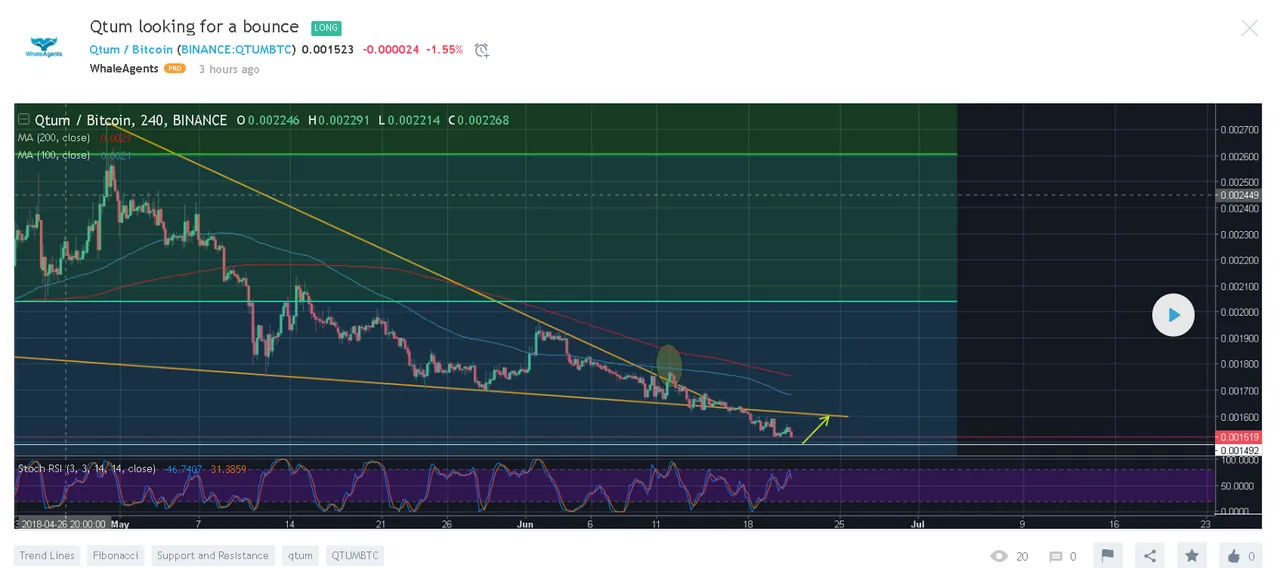
The downward trend line connecting lower highs has been broken as the price closed below it. The RSI is also near the highs currently which points out to lower trading prices in the near future. As far as the Fibonacci retracement levels are concerned, the coin broke the key 61.8% level and for some time now trades below it. The next level of support is 78.6% which coincides with the horizontal level of support - 0.0012300. However, before we can think about making a move towards that level, a previous swing higher started from the 0.001500 level after creating a short-term bottom. Hence, we expect the price to hit this level first and bounce given its importance. Hence, a swing trades can be placed based on these levels:
Entry: 0.001500
SL: 0.001450
TP: 0.001600
We are looking for a re-test of the downward trend line that will now act as resistance. The trend line currently sits just above 0.001600.
R:R in this trade is 2:1.
Join Our Cryptocurrency signals Telegram Channel
Follow us on Twitter
Official Website
About us
Original post posted by us on Trading View - https://www.tradingview.com/u/WhaleAgents/