I have a feeling that many people in cryptocurrency technical analysis forget or ignore volume. For me it is a very important thing. Volume gives us answers to many questions for example: „Is this movement supported by investors or is it just a lack of liquidity?” or “where should we looking for confirmation (support, resistance, formations etc)”?
My point of view on cryptocurrency trading is very simple. I try to use uncomplicated tools besides trend lines (ofc ;) ), support and resistance lines, major formations (SHS, triangles etc), candelstick formations, moving averages and volume.
Ok... What is volume? Volume is the number of shares, bonds, contracts, or any other instruments that were in the period of transaction. In simple words, volume reflects investor activity. You can find it at the buttom of the chart and it is shown as a histogram (verdical bars)
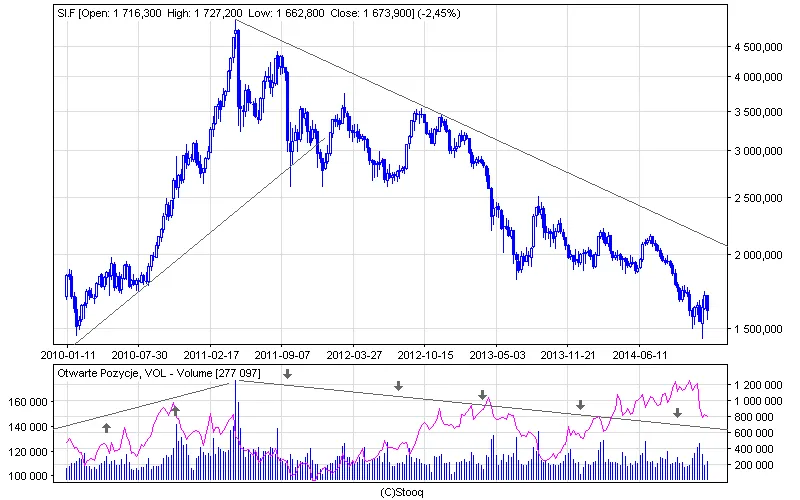
As you can see on the picture, volume is rising during the rising trend and falling during the downward trend. It is chart of silver with a one week interval.
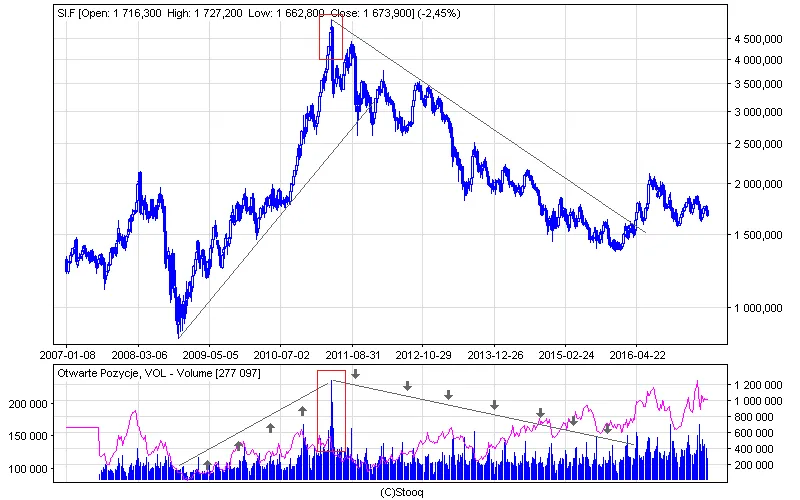
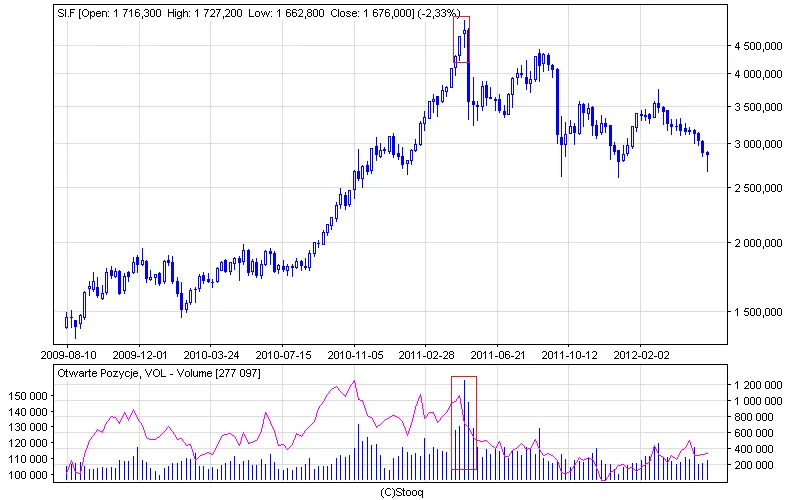
Look at the volume in red. It was much higher than in the past. This was the climax of the upward trend in which investors decided to sell a large number of contracts. This volume and candle formation IMO "doji star" were a confirmation. This formation changed the trend for a very long time.
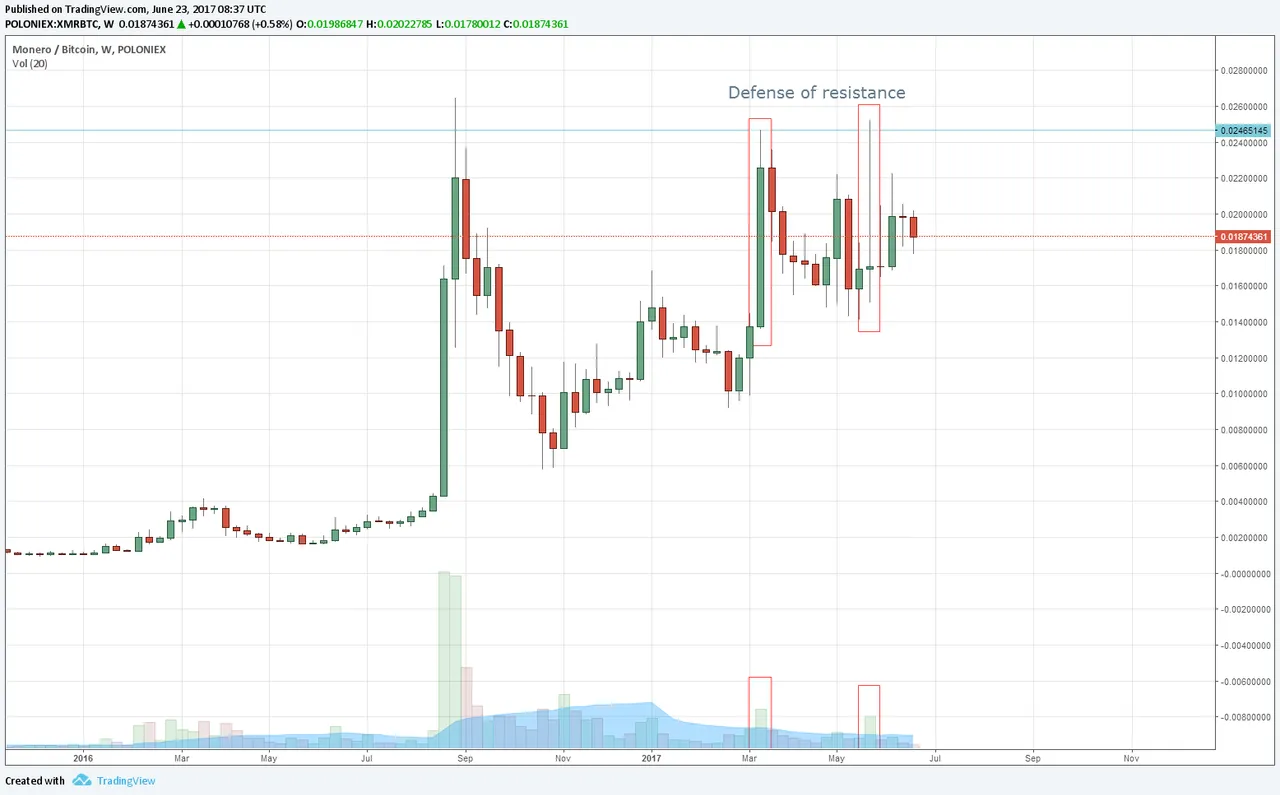
Ok I gave you an example from the commodity market. Now I'd like to present a few examples from the cryptocurrency market on many different intervals.
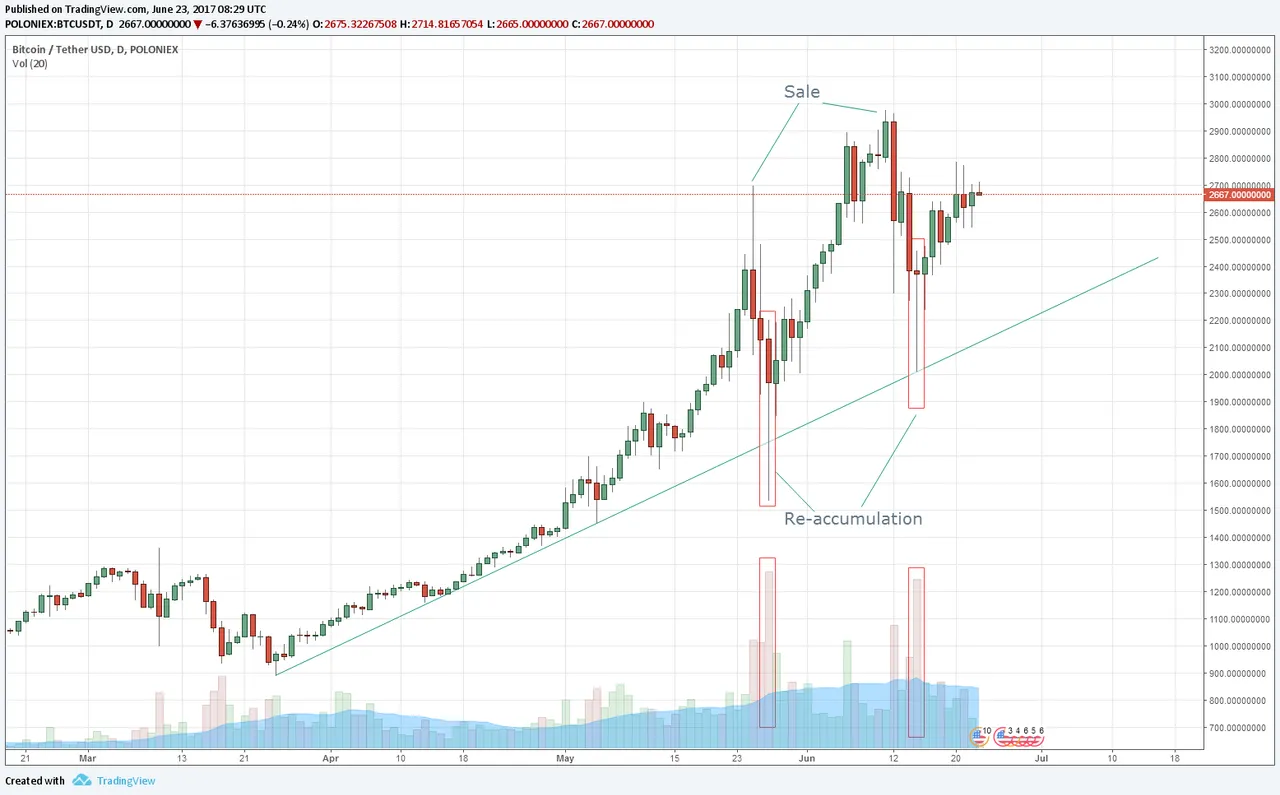

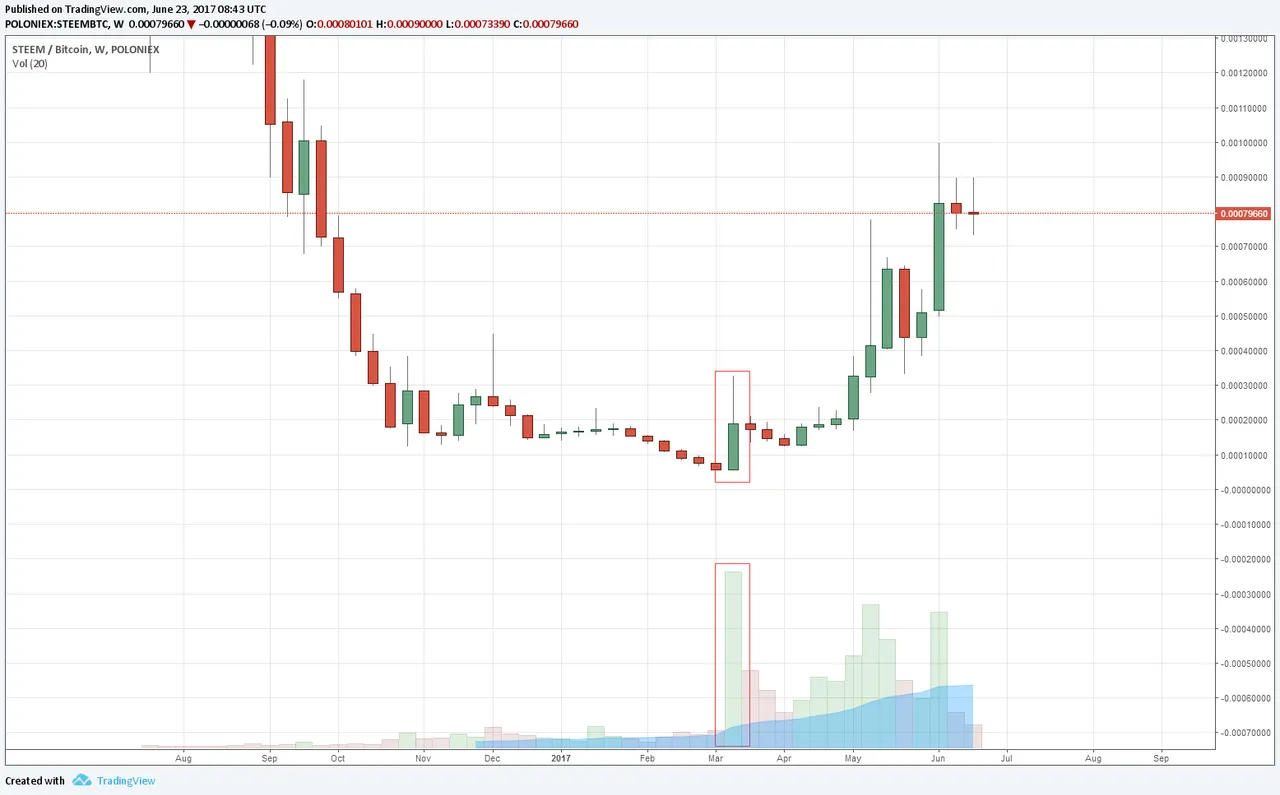
And... Steem :)
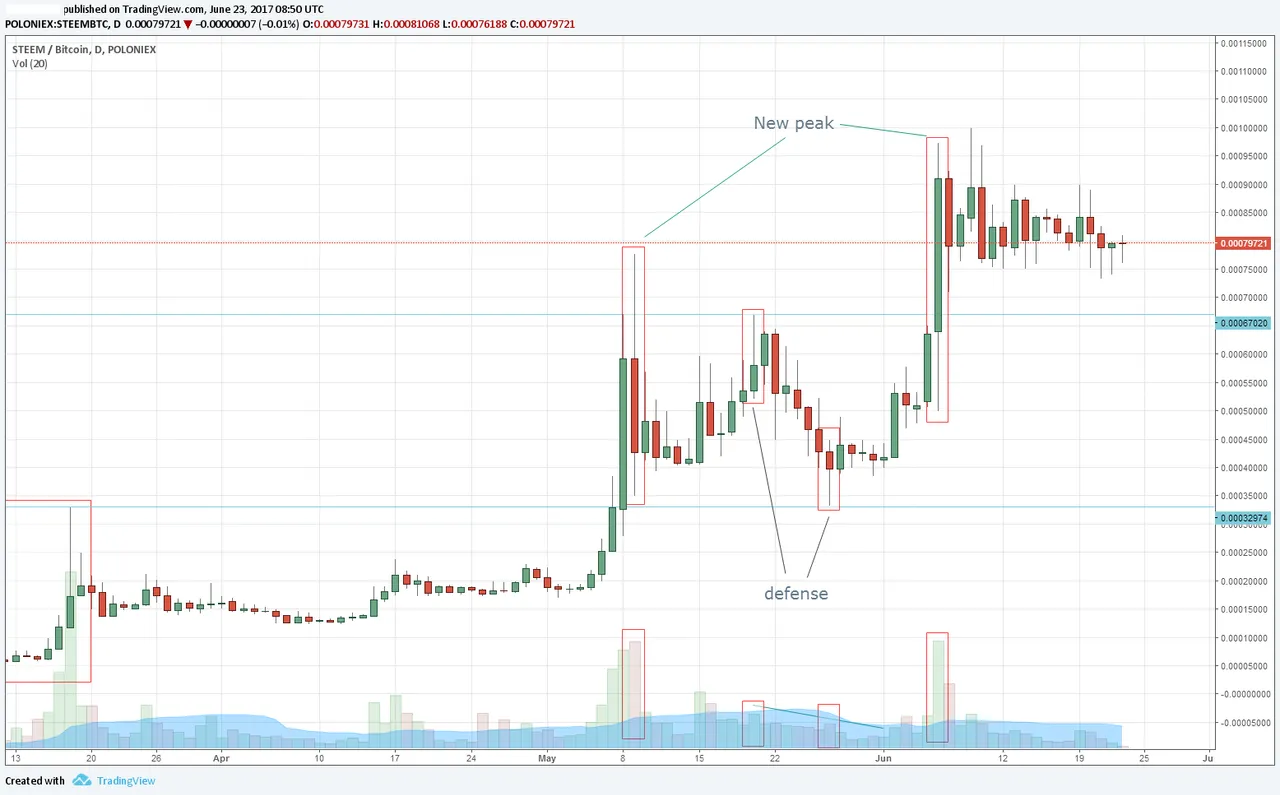
As you see the volumen and (sometimes) additional information give signals that can help when making a buying and selling decision. Good luck! :)