Hey guys,
This is my first post on harmonic patterns, check it out.
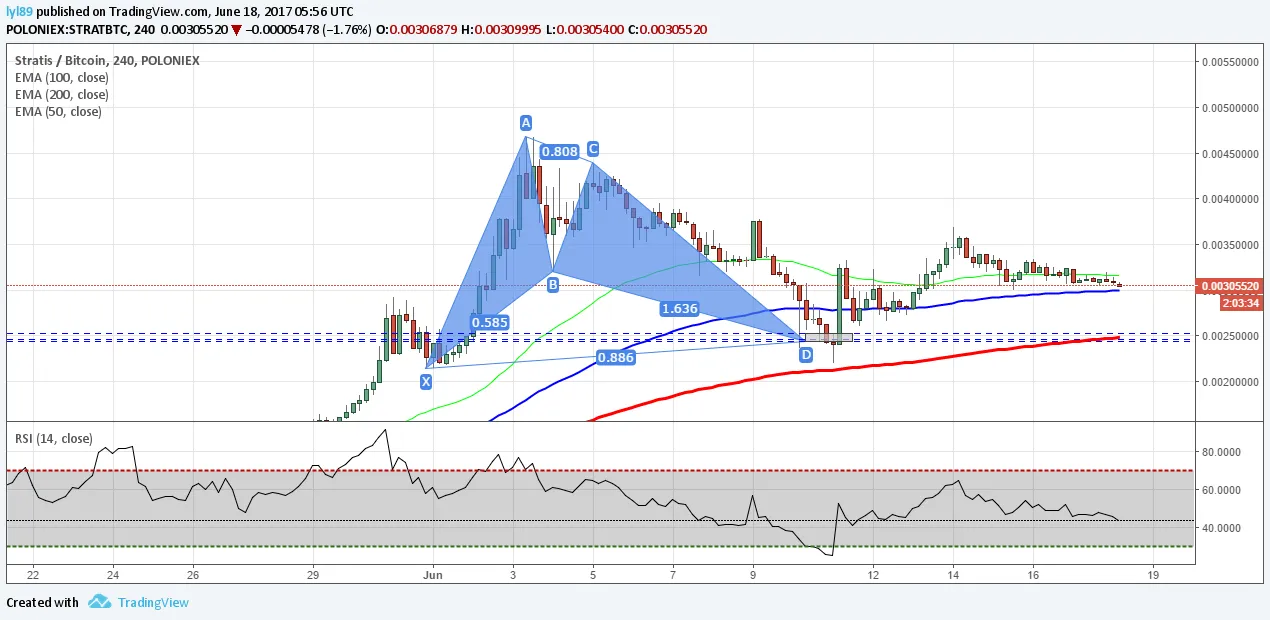
This is a typical bullish bat pattern :
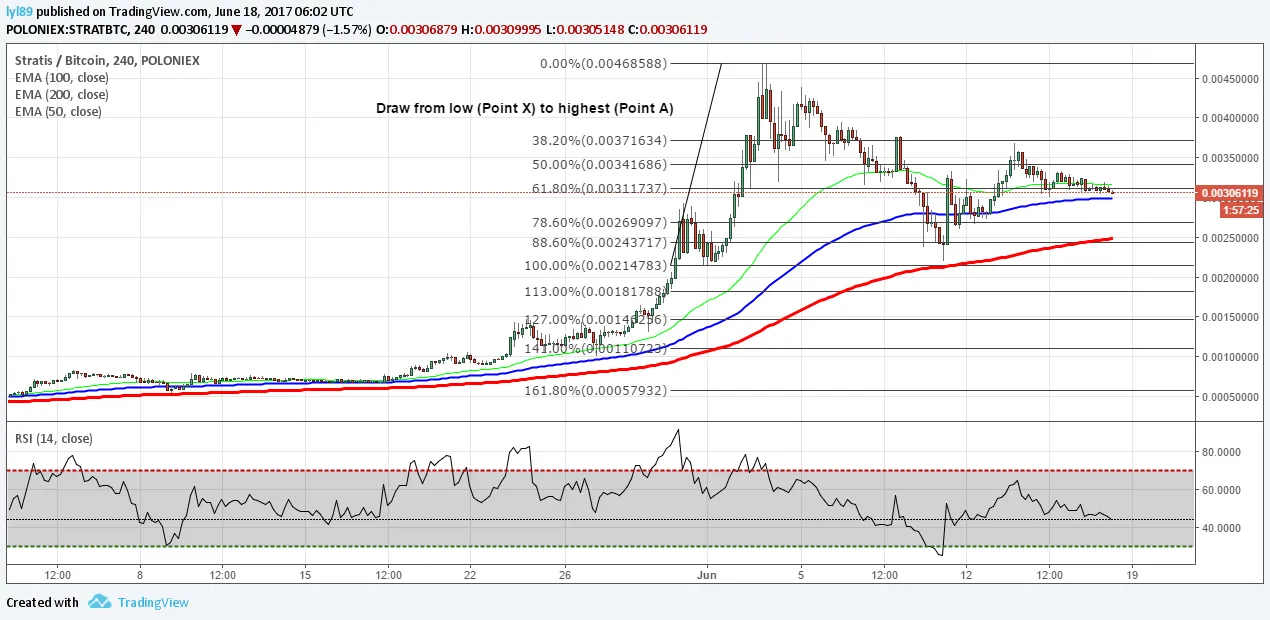
Select the Fibonacci retracement tool in any platform you are using, I am using TradingView for drawing.
X-A Leg
The first leg forms when the price rises sharply from point X to point A.
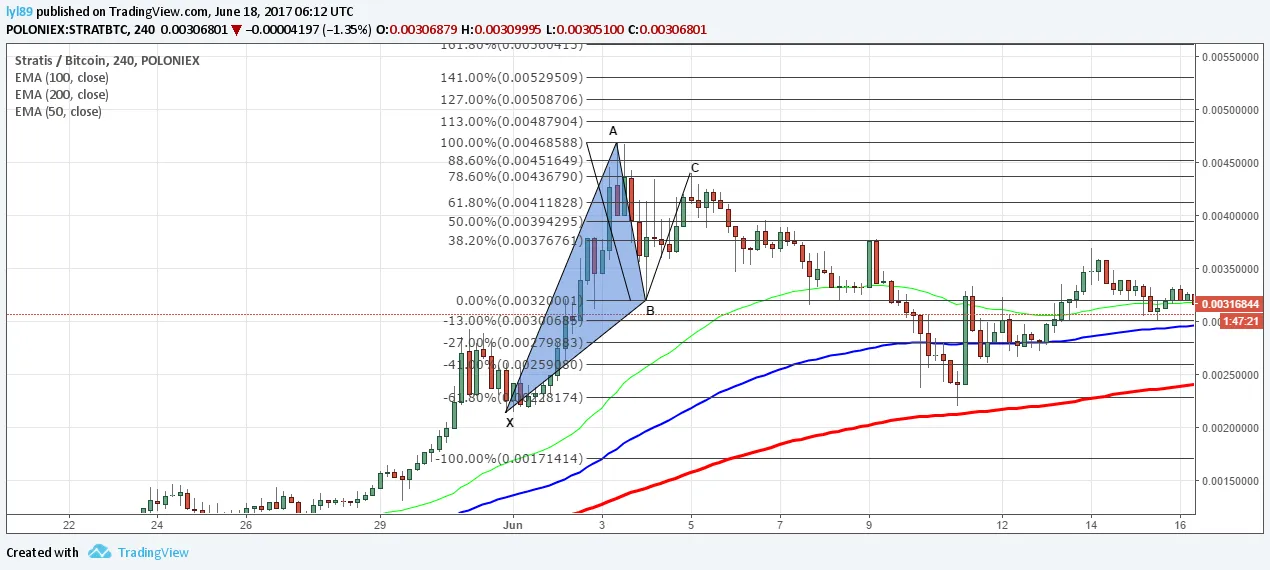
A-B Leg
Point B : 38.2% to 50% retracement of XA, price should not touch 61.8%.

B-C Leg
Point C : 38.2% to 88.6% retracement of AB
C-D Leg
Point D is determined by 3 lines, which form the Potential Reversal Zone (PRZ), indicated using the grey box.
Line 1 : 88.6% fib retracement of XA leg
Line 2 : 161.8% to 261.8% fib extension of BC leg
Line 3 : Select the Fibonacci expansion tool to draw the AB=CD pattern, Point D should be minimally at 1, or closest to the other 2 lines.
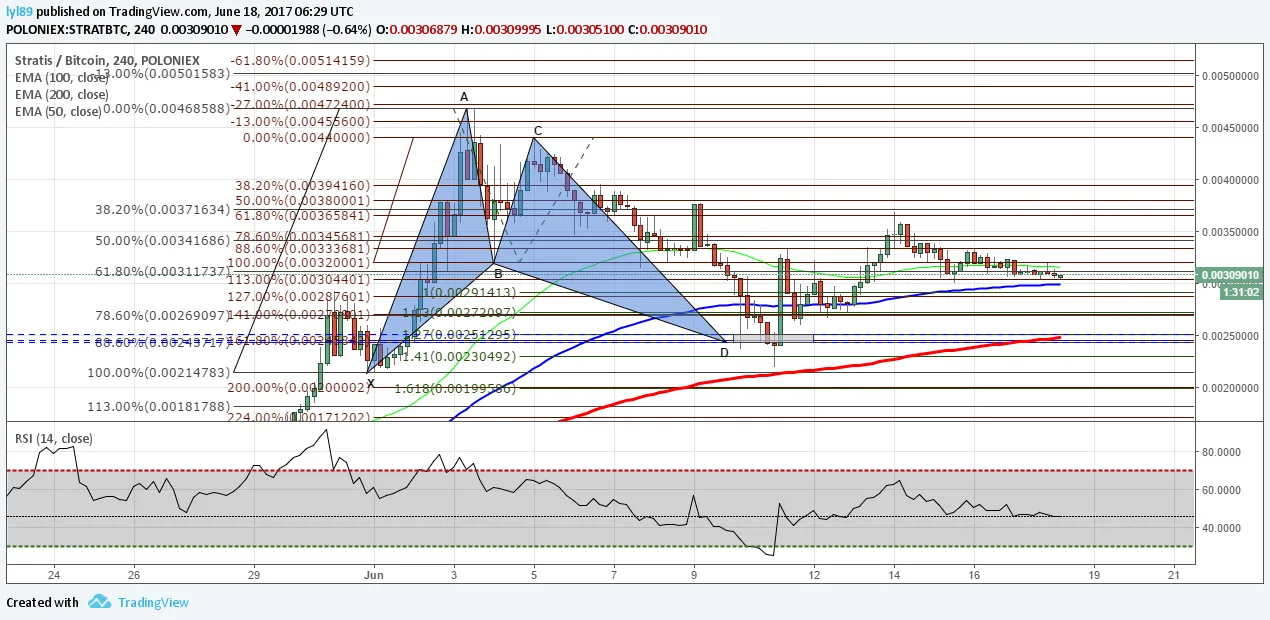
It is interesting how price respects to these Fibonacci retracements.
Once the price has touched all 3 lines of PRZ, we are looking to long Stratis. 2 Profit targets are determined by XA fib retracement.
Profit target 1 (TP1): 38.2% AD retracement
Profit target 2 (TP2): 61.8% AD retracement
Stop loss (SL): Slightly below Point X
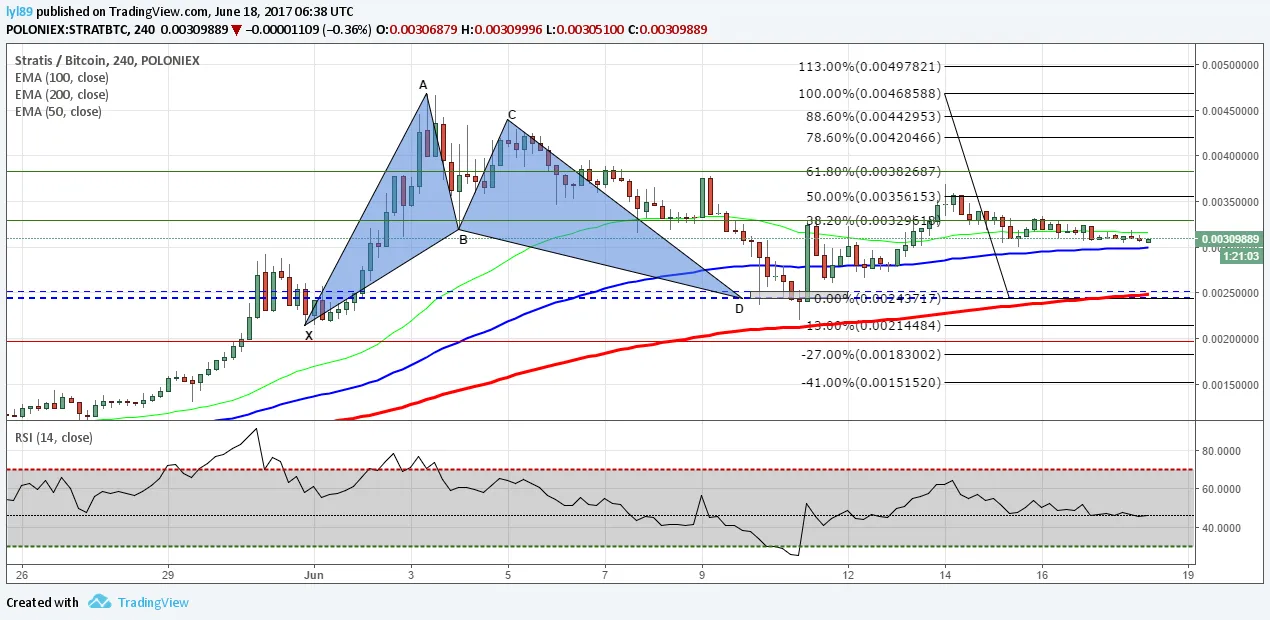
As you can see, price reacted to the harmonic pattern and we have reached the first profit target.

Based on my trading experience, TP1 is always easier to be achieved than TP2.
Reason is because new patterns might form along the way, you will get used to it after multiple practices.
I hope you guys have learnt something from this post, do practice yourselves.
Cheers =)