Im going to Show that Placing Rigid predetermined STOPs to a Trade is a BAD Idea that will COST MUCH MORE money than you will EVER Save.All Pro.s/Mentors Insist you ALWAYS use Stops its an Insurance policy that if a Trade goes Wrong you WONT Lose too much money.Like other Insurance Products House, Car, Life etc you can spend Tens/Hundreds of Thousands of pounds over your lifetime and Never Need it!
'Chart Patterns'(my pet hate) I will discuss in full at a later date are a gimmick created a century ago these are where a formation on a stock chart is likened to a 'head & shoulders' 'cup and handle' etc similarly there are a number of 'triangle patterns' after lengthy research I can tell you that NONE of these patterns can reliably inform you of future direction(better to toss a coin)Probably the most famous practitioner of these Patterns today is @PeterLBrandt who has forged a career since the 1980's replicating these earlier patterns
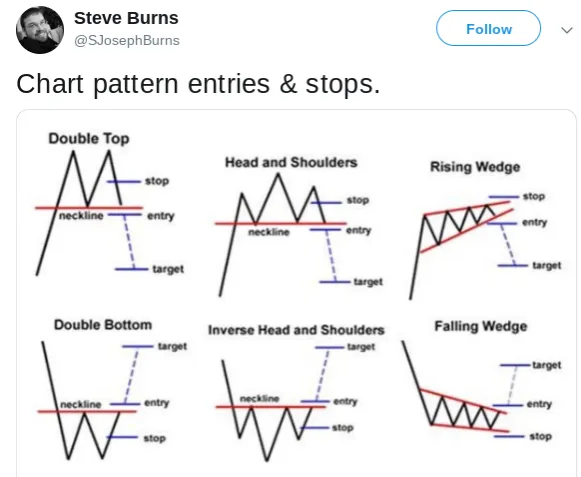
Heres 'Steve Burns' self appointed Trading Mentor/Author having sold Countless books Explaining How to Trade Successfully.Heres his guide on How to Trade these Patterns
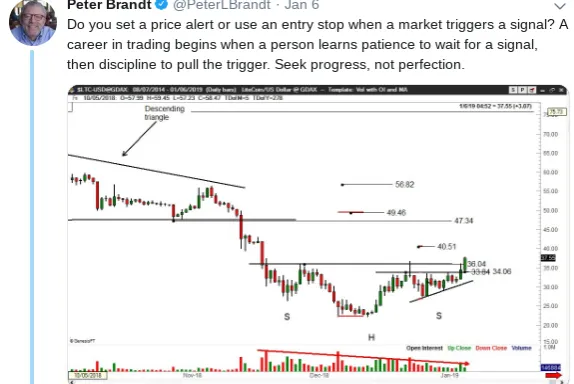
Okay recently Peter Brandt posted THIS 'Head & Shoulders' Trade on Twitter (LITECOIN)Showing a BUY after the Price had Broken Out of the Pattern. The Predetermined STOP is Shown IF the Trade Fails(along with a Target if it succeeds)
I use a very simple TradingTechnique that ONLY uses Diagonals and showed him a Diagonal that would offer RESISTANCE to Price
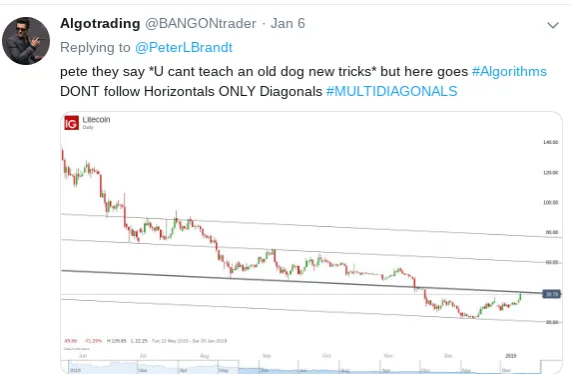
Lets look at the Chart of $LTC (Litecoin) Today
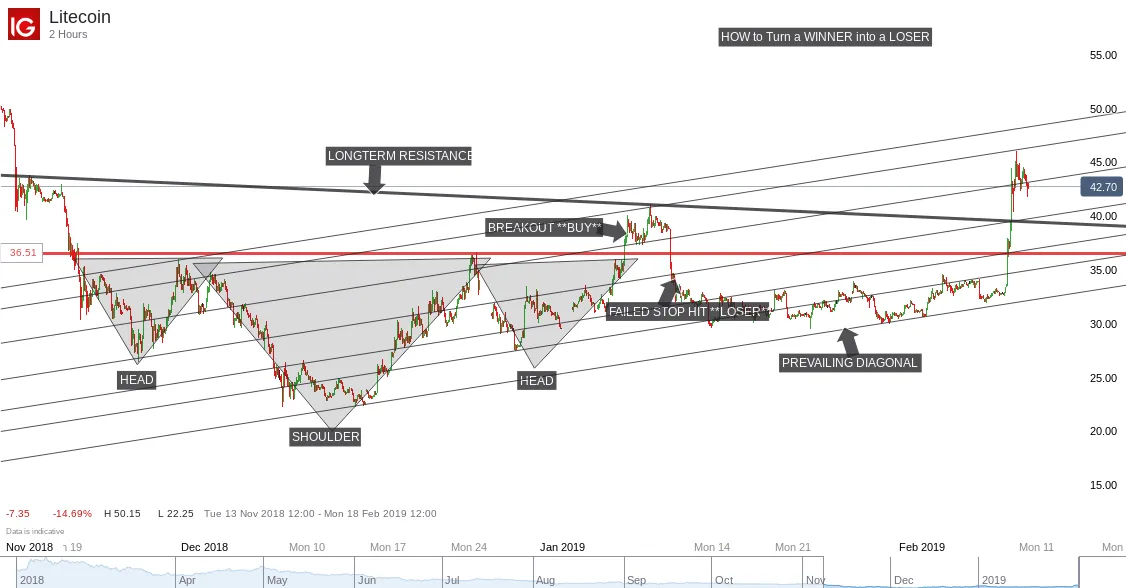
You can See the 'Head & Shoulder' pattern the BUY Entry & STOP the RESISTANCE(BOLD) that Halted the Trade
Ive Included these 'secondary' diagonals (prevailing) that have Directed Price & Help us to Trade successfully.Regardless Peters Entry SHOULD have been a Decent WINNER (almost +20%) but because of the RIGID STOP it was a LOSER!!
The problem with Trading 'patterns' is They CANT forecast Future Price so you are simply GAMBLING therefore when the Trade goes against you theres little option but to SELL at a LOSS and Try again.Placing #MULTIDIAGONALS on the Chart shows ALL the various Supports&Resistance giving you the Confidence to Monitor & re-evaluate Trades as Price developes