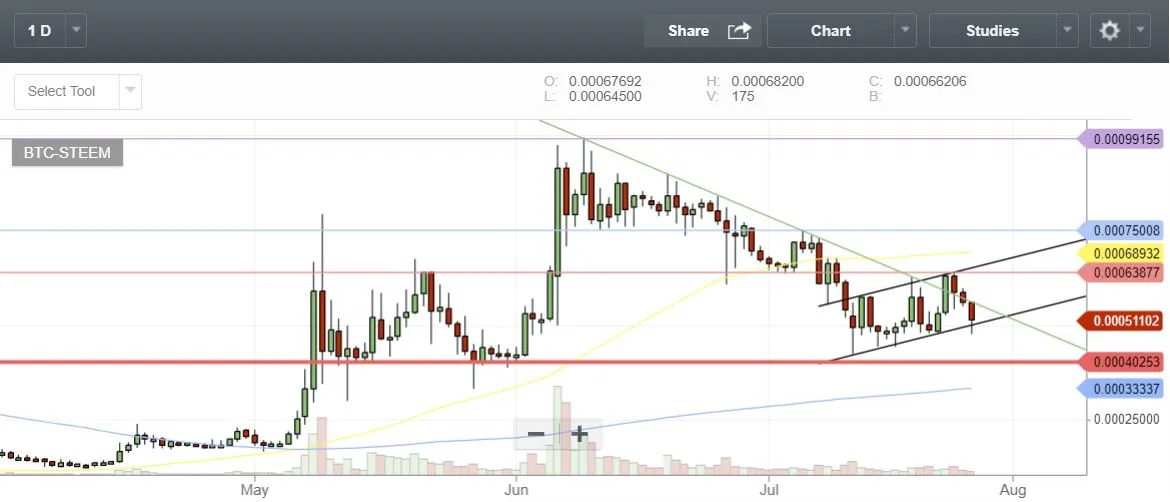
BTC-STEEM daily chart
Daily chart of STEEM is finally showing some bearish signs. The trend-line has been broken three days ago and I would say that the bottom is in. On July 11th price reached 0.00042 BTC which was the lowest price since June 2nd and indicators suggest that it was the lowest point and we are going up from here.
BTC-STEEM daily
Going forward
Price is at 0.0005 BTC and currently in dip on the hourly chart, so this is not a bad time to buy. I expect the price to stay in this channel moving slightly up with a healthy angle. Estimated target area 0.0007 BTC around mid August.
Everything seems to be good for now. So let's hope that the Bitcoin price doesn't have major breakdown and we can keep enjoying the perks of growth in our local currency.

Previous posts
- Bitcoin Cash (ViaBTC) - User Activated Hard Fork (UAHF): https://steemit.com/bitcoin/@eviljedi/bitcoin-cash-viabtc-user-activated-hard-fork-uahf
- Litecoin technical analysis (update): https://steemit.com/trading/@eviljedi/litecoin-technical-analysis-update
- Ethereum technical analysis https://steemit.com/cryptocurrency/@eviljedi/ethereum-technical-analysis
- Litecoin and Bitcoin technical analysis: https://steemit.com/cryptocurrency/@eviljedi/litecoin-and-bitcoin-technical-analysis
- Monero technical analysis: https://steemit.com/trading/@eviljedi/monero-technical-analysis
If you like my content
Don't forget to Upvote, Resteem and Follow me @eviljedi