Daily chart
I was drawing symmetrical triangle before (see here), so here is what happened. Perfect break-out right as the triangle closes, same as before. Also we see a double top at 0.0219 BTC on May 10th and July 5th, which means we are definitely going higher and the resistance is expected to break any day now.
BTC-LTC
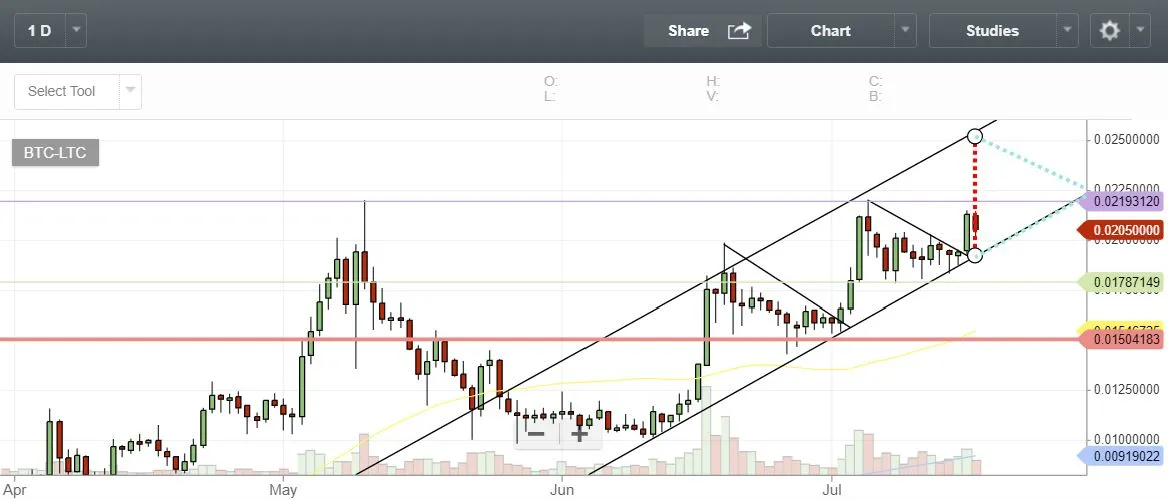
I drew a projection triangle where the price is most likely to stay for the next 10-12 days. So now we are looking for the initial break-out to around 0.025 BTC. It should be sizable green candle with long wick above, or the wick could be on the next red candle. If we don't see the long wick above one of the following daily candles, I expect the price only to go higher.
Weekly chart
BTC-LTC weekly chart is supporting this bullish trend and projecting potential growth for 4-5 more weeks. My initial prediction of Litecoin price reaching 0.029 BTC within a month, still stands. So I'm still HOLDING.
Previous posts
- Ethereum technical analysis: https://steemit.com/cryptocurrency/@eviljedi/ethereum-technical-analysis
- Litecoin and Bitcoin technical analysis: https://steemit.com/cryptocurrency/@eviljedi/litecoin-and-bitcoin-technical-analysis
- Monero technical analysis: https://steemit.com/trading/@eviljedi/monero-technical-analysis
If you like my content
Don't forget to Upvote, Resteem and Follow me @eviljedi