Trading & Investing - Part 1 of a brief Guide
Points of Inflection
A point of inflection is a period on a line graph, where the curvature of the statistic changes. A new direction is chosen. This can occur at a peak or trough or during periods where the curvature has flattened.
In trading and investing, the point of inflection is a trend shift and what individuals look for as buy and sell (short) opportunities. Technical analysis uses multiple indicators that help traders predict when the curvature of a graph will change.
In this series, we are going to explore trading methodology, tools, and indicators.
True technical traders, don't particularly care what the catalyst is that drives a trend shift, and in fact, the very best are positioned ahead.
For fundamental traders, inflection points occur when a news item, event, changes the curvature causing a trend shift. In stocks, this could be an earning, a product launch, regulatory investigations. In crypto one of the most recent fundamental points of inflection occurred when Chinese regulators cracked down on ICO and a few exchanges creating uncertainty.
For a technical trader, inflection points occur at an area of resistance or support and can simply be attributed to areas of supply and demand based on chart history. Price tends to gravitate towards these areas as part of normal market fluctuations. Technical analysis is about determining these points on the curve and using them as buy and sell signals.
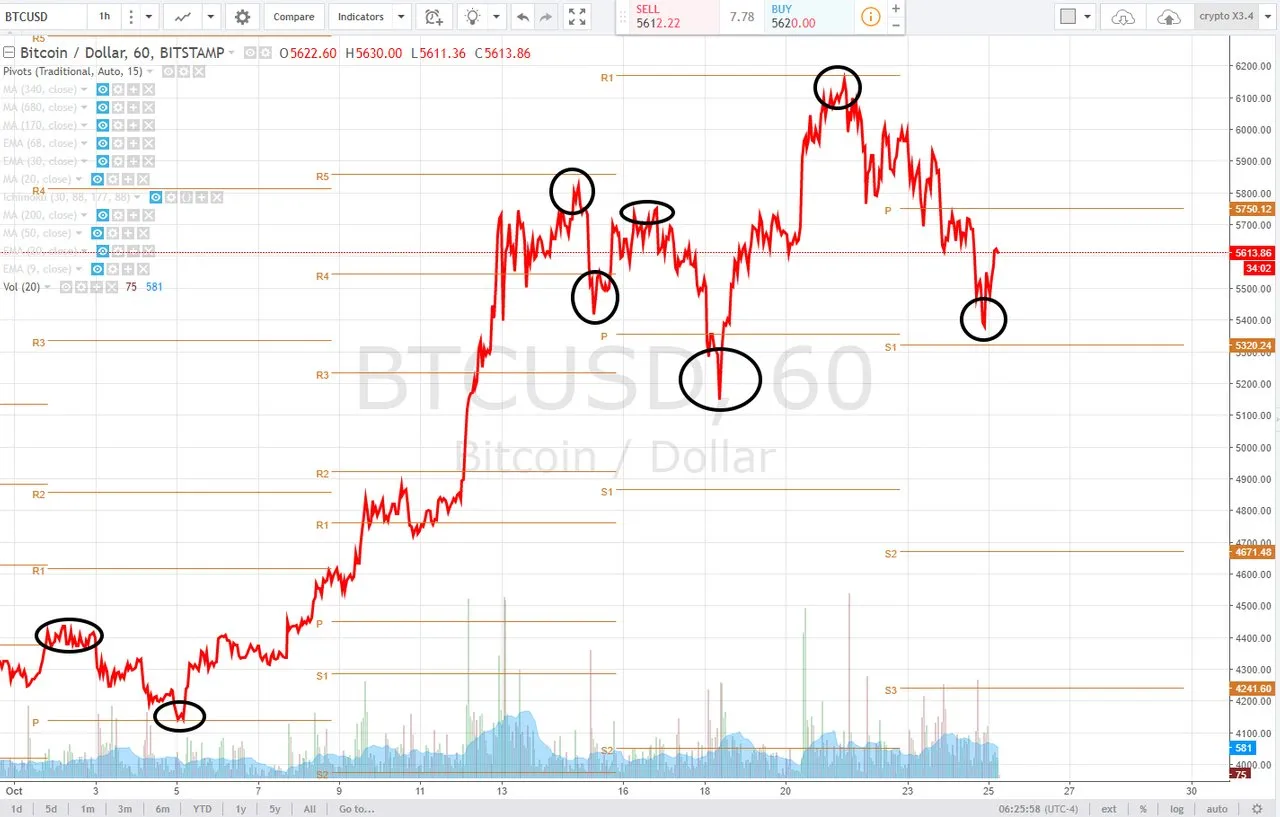
The following is a chart of BITCOIN with some points of inflection highlighted by the black circle to demonstrate the concept.
Technical Indicators
In my experience major technical and fundamental events tend to converge at the point of inflection and result in large-scale moves, this can be major news, or a, "sell the news event." Hardest of all to predict are black-swan events, which are theoretically impossible to predict, though often times price action will lead.
Charts tell the story of an underlying asset and are merely the statistics that make up price action visualized. You can always review past events and how the price reacted - Did the news gets priced in and have a follow up sell off? Was the news a total surprise and result in a rally. What was the price doing right before the event occurred? Studying chart history doesn't necessarily predict the future, not in the slightest, but it is a good way to study market behaviour, investor behaviour, trader behaviour.
We are going to look at the following Technical Analysis Tools and any others requested by our audience and community. In my personal opinion, simple is better, complicated indicators drive confirmation bias, certain tools can be likened to gambling, and a lot of the time personal bias can drive self-fulfilling prophecies in regards to charting - we aren't robots.
You can get a head start by exploring the definitions of these tools online at Investopedia or Stockcharts.com.
Throughout the series, we will also explore fundamental drivers that can affect the price of an underlying asset and what is important to look out for. For starters, the MARKET CAP is more important than current trading price as total supply changes. The technology driving a cryptocurrency is in many regards the most important aspect of a coin or token, but might not be able to outweigh any hype or FUD.
Today Let's talk about some rules
source
- Capital Preservation.
- Keep accurate Records.
- No Chasing and don't panic.
- Respect Stop Losses.
- STUDY.
- Practice.
- Understand Basic Market Dynamics.
- Block out noise - FUD or HYPE.
- Know when you are trading, investing or gambling.
In our next part of the series, we will explore basic Market dynamics and address what these rules mean and how they can make you a more successful trader before we begin to touch on technical and Fundamental Analysis.