Stablecoins have become an essential part of the crypto industry. The crypto dollars have been useful for people outside of US, where their local currency is not performing at best. More people and businesses are starting to accept and work with crypto dollars. We are witnessing a whole new sector emerging in the crypto industry, and there seems to be a lot of interest from a lot players to enter the game. Paypal has been one of the new brands entering the in the market with its pyUSD in 2024.
How is the dominant and the incumbent in the industry doing in the last period. Let’s take a look!
Tether started its journey back in 2015 and allegedly it was founded by the Bitfinex exchange.
A lot can be said about Tether, a history with controversy, mainly around the fractional dollar reserves, or is every USDT backed by equal amounts held in banks accounts. There have been court cases etc, but up until now Tether has been able to manage the situation and keep growing.
One of the biggest wins for Tether is the way they handled 2022 and all the moments when projects collapsed, causing domino effects. On a few occasions there were massive amount of withdrawals initiated in a short amount in time. A massive 15B were withdrawn from Tether during the stablecoins crisis in May 2022, and later the collapse of FTX as well. Some other crises are in between as well.
Tether successfully handled all the withdrawals and the crisis in between. A massive real market test that it passed.
With this said, let’s take a look at the data for USDT.
Daily Tether Printed
Here is the chart for the USDT printed per day.
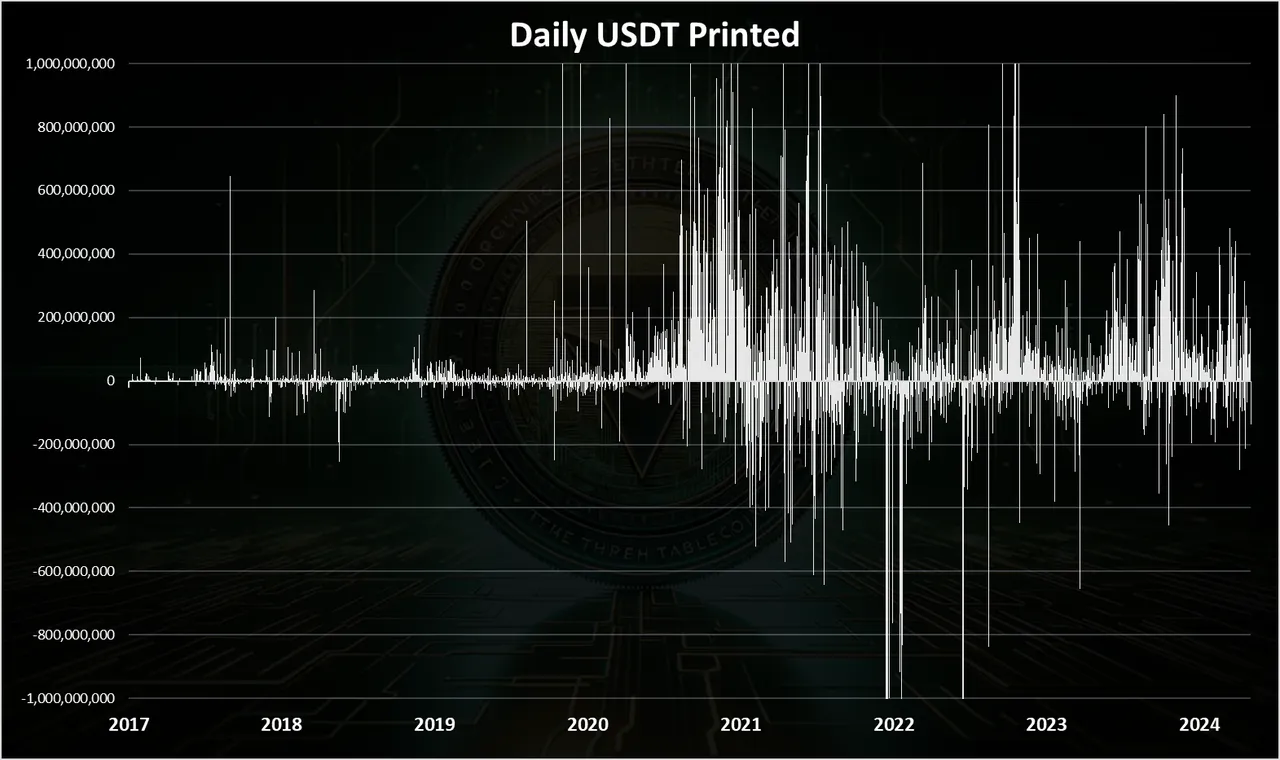
As we can see in the first years there was not a lot of printing for USDT. The larger amounts started to come in 2020 and increased significantly in 2021.
On occasions there was more than 1B USDT issued or burned per day. We can notice a few spikes down in 2022, some of them with more than 5B on a day. In the last period in 2024 we can see a positive bars once again.
When we zoom in 2023-2024 we get this:
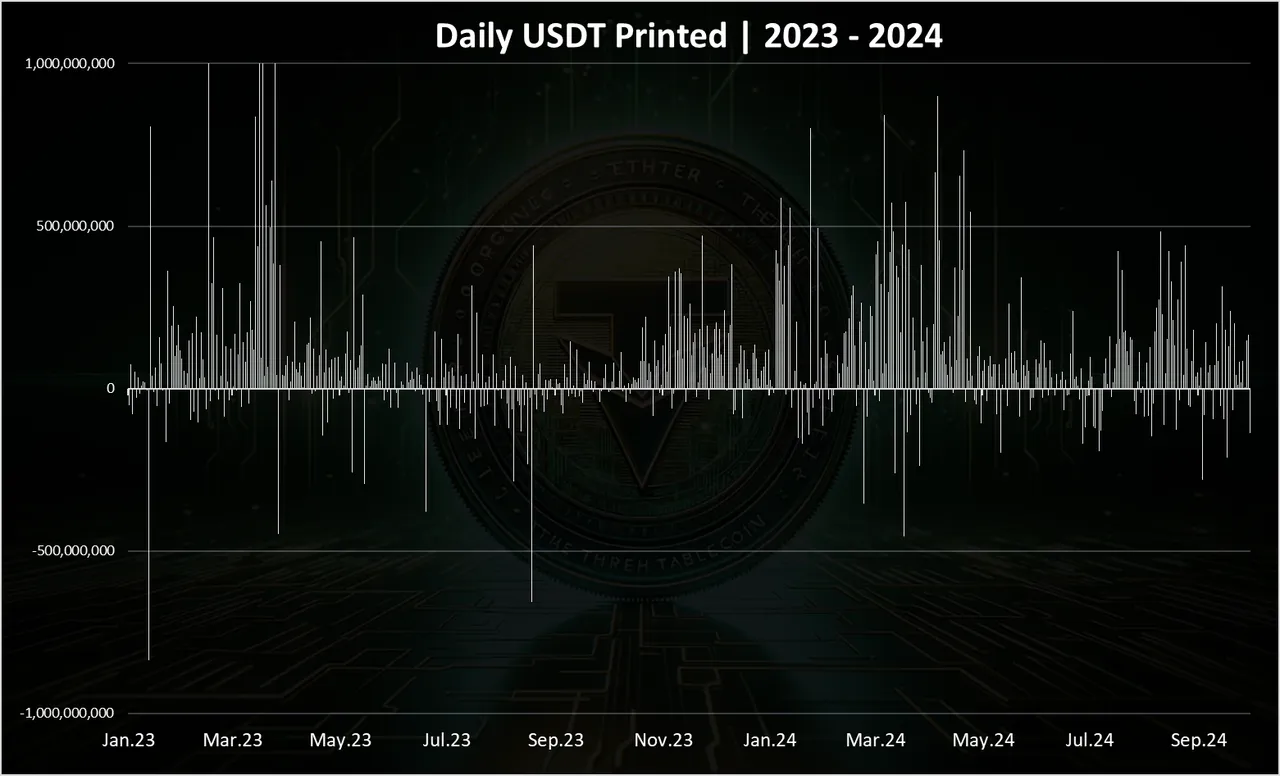
In 2023 and 2024 we can see mostly positive daily bars for Tether.
There was a growth in the Tether supply especially in March 2023 and again in March and April 2024. Back in 2023 there was a sharp increase in the Tether supply due to a crisis with its competitor USDC. In the summer and autumn of 2023 there was less volatily and low amounts of Tether printed, and then towards the end of 2023 the numbers started growing. In 2024 the trend continued and there was more Tether printed in the last few months.
Monthly USDT Printed
Here is the monthly chart.
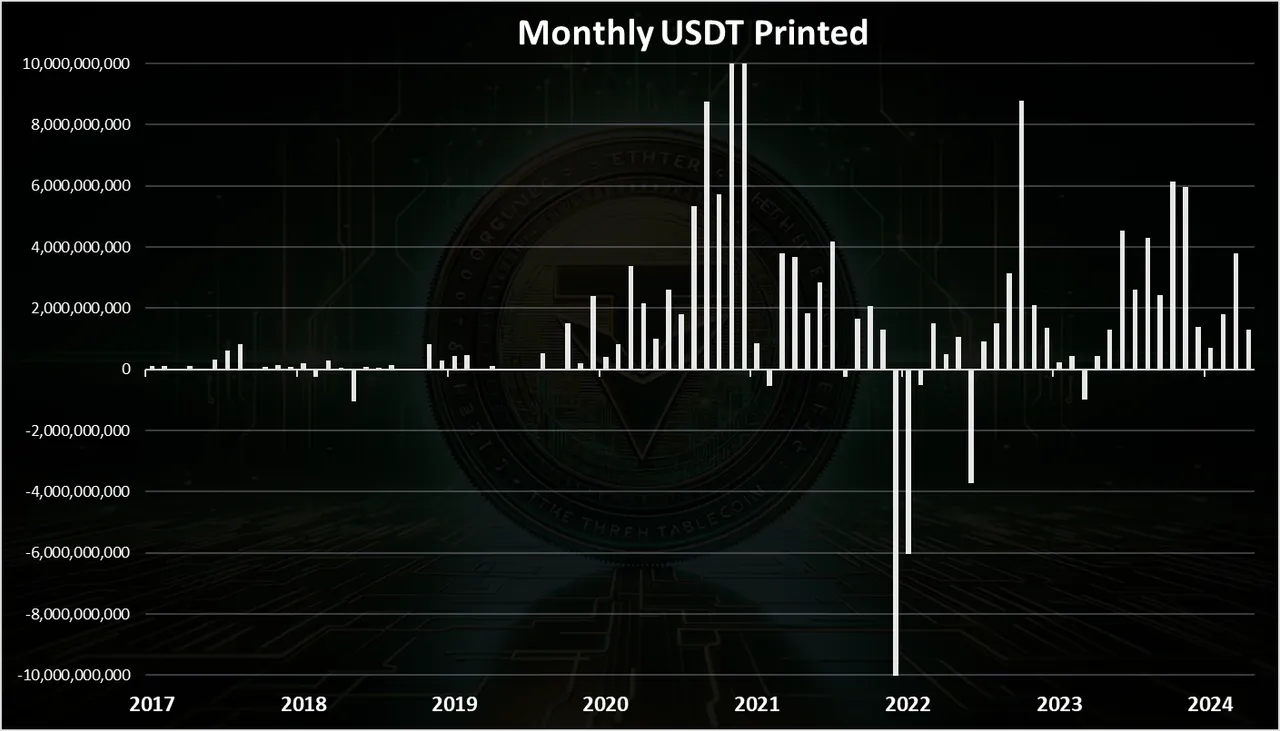
The record for USDT printing on a monthly level is in April and May 2021, with 10.5 billions printed in each of these two months. On the downside the record for USDT burned has been May 2022, with 10.7 billions burned in that month. A totally opposite situation in just one year.
**When we zoom in 2023-2024 we have this:
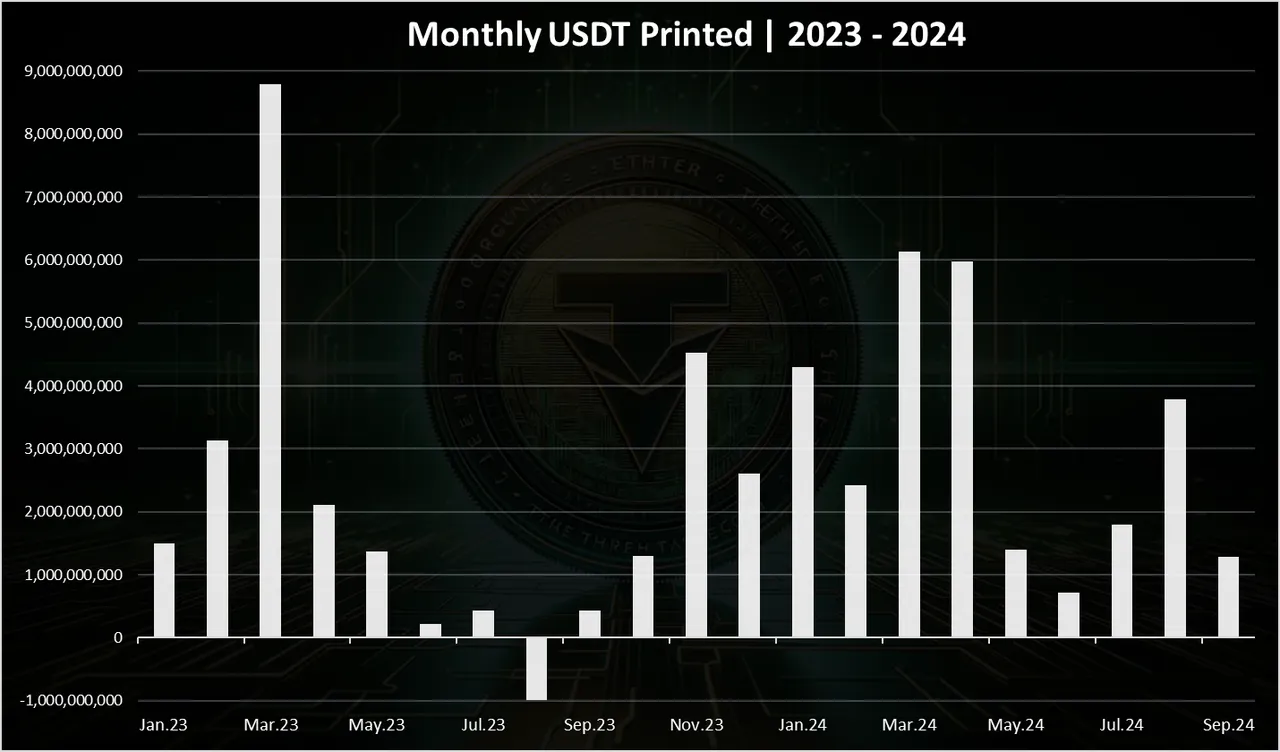
We can see that March 2023 was a great month for Tether. This again due to the crisis that was happening at USDC, a lot of funds were accumulated by Tether, almost 9B. A slowdown toward the end of 2023, and an increase again with March and April 2024 reaching 6B. Each month of 2024 has been a net positive for the amount of Tether in circulation.
Tether Supply
The chart for the USDT supply looks like this.
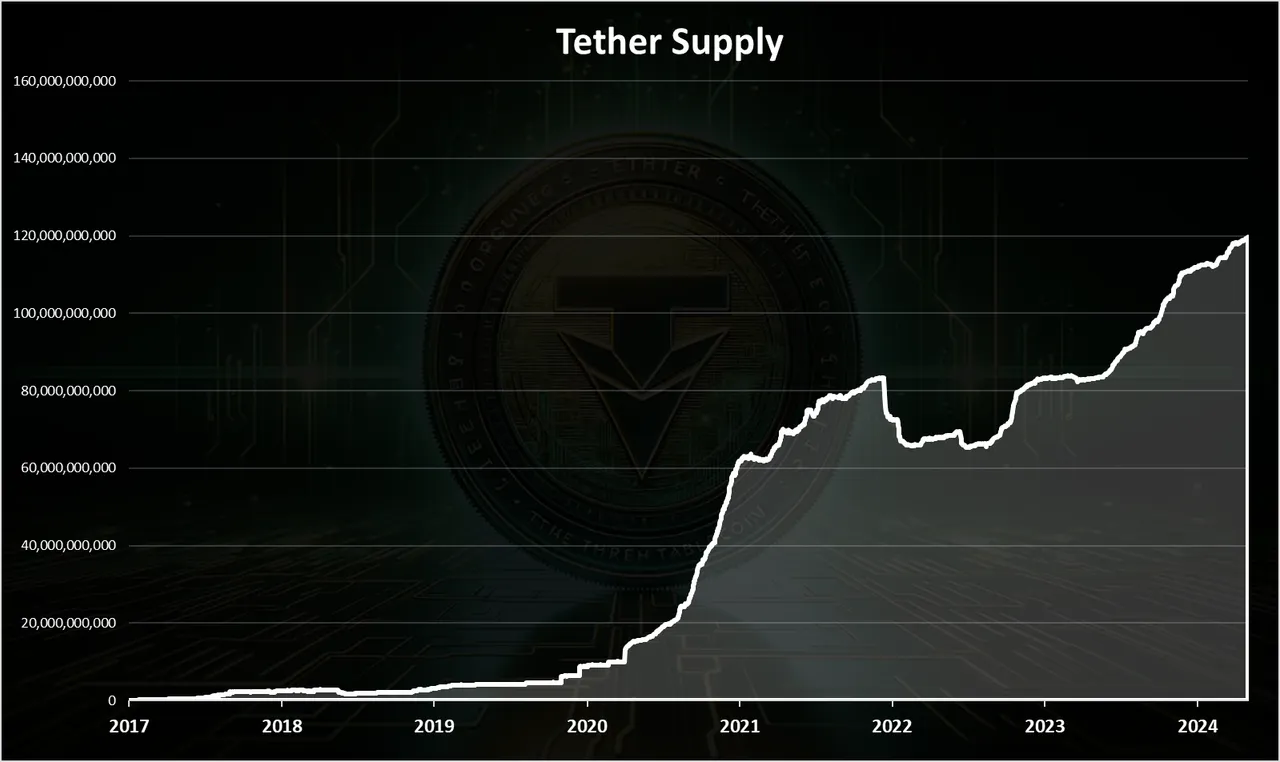
A big increase in 2020 – 2021 period, reaching 83B in market cap in the beginning of 2022. Then in May 2022 a big drop, and in the summer of 2022, the market cap of Tether was around 67B.
A strong growth in the first quarter of 2023, a slowdown in the summer of 2023 and then a growth again towards the end of 2023 and all of 2024.
In the last months Tether has set a new all-time high with now close to 120B in circulation. The 100B mark was passed at the beginning of March 2024.
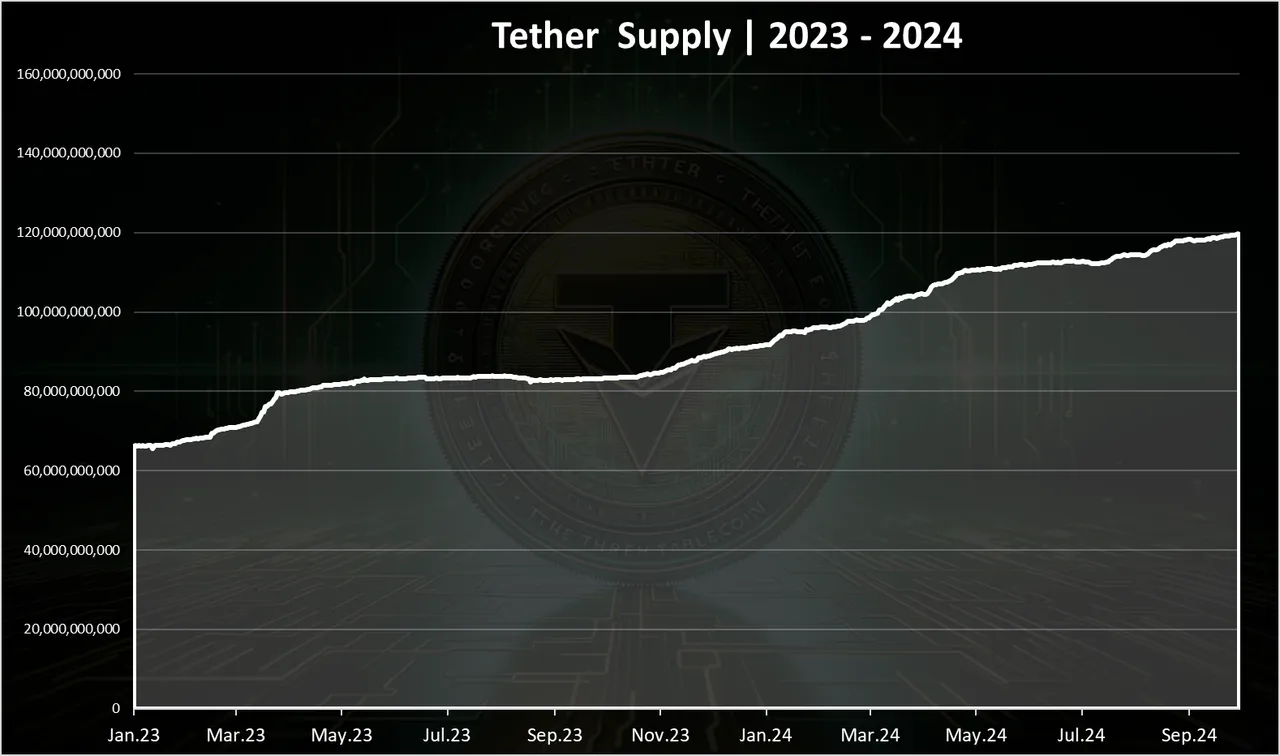
Here we can see more closely the growth in the last two years. A continuous growth.
USDC VS USDT
How is Tether doing against the number one competitor USDC? USDC has come a bit later to the scene, so it has some catching up to do.
Here is the chart.
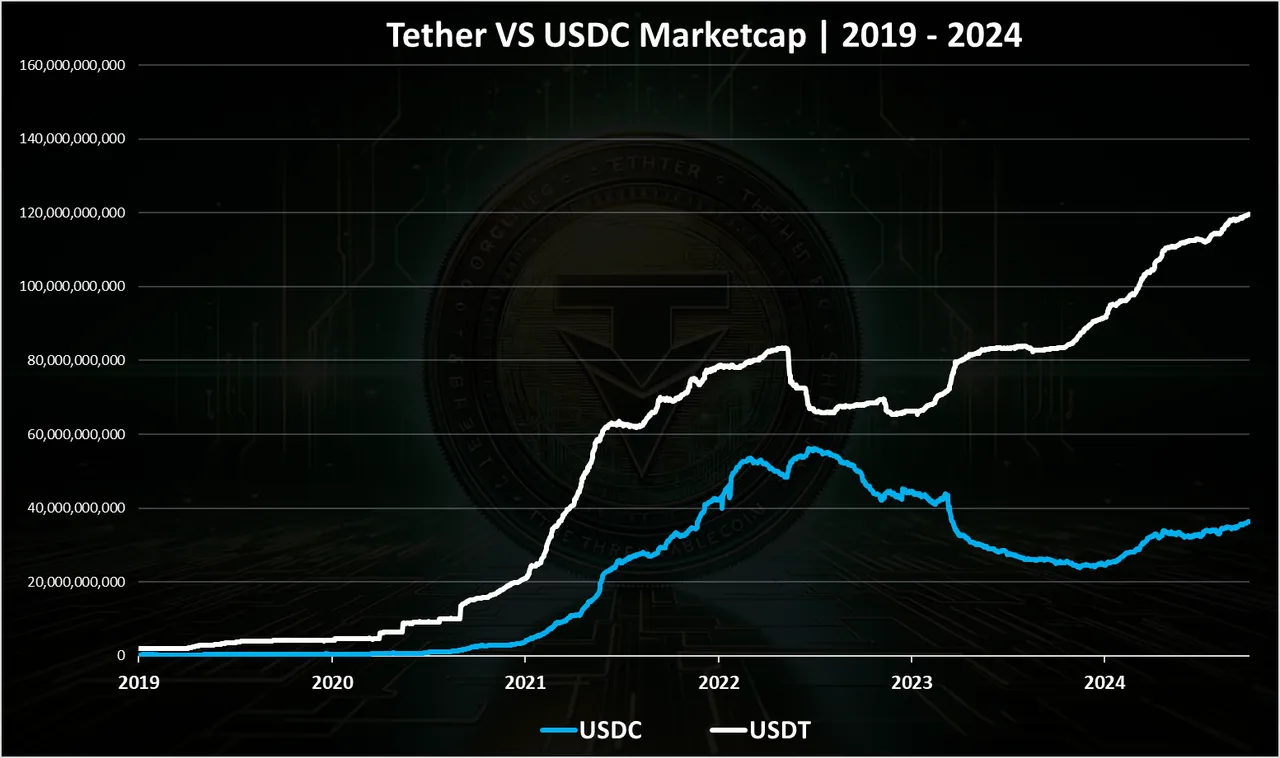
Up until May 2022, both stablecoins had a similar pattern. Then TerraUST happened and the market cap for Tether decreased while the market cap for USDC increased. This short lived as Tether regain its growth, while USDC kept going down.
During the bear market these two moved in opposite directions. In the last months the trend changed and now both of the stablecoins started growing again with Tether growing faster then USDC.
If we zoom in 2023 - 2024 we got this:
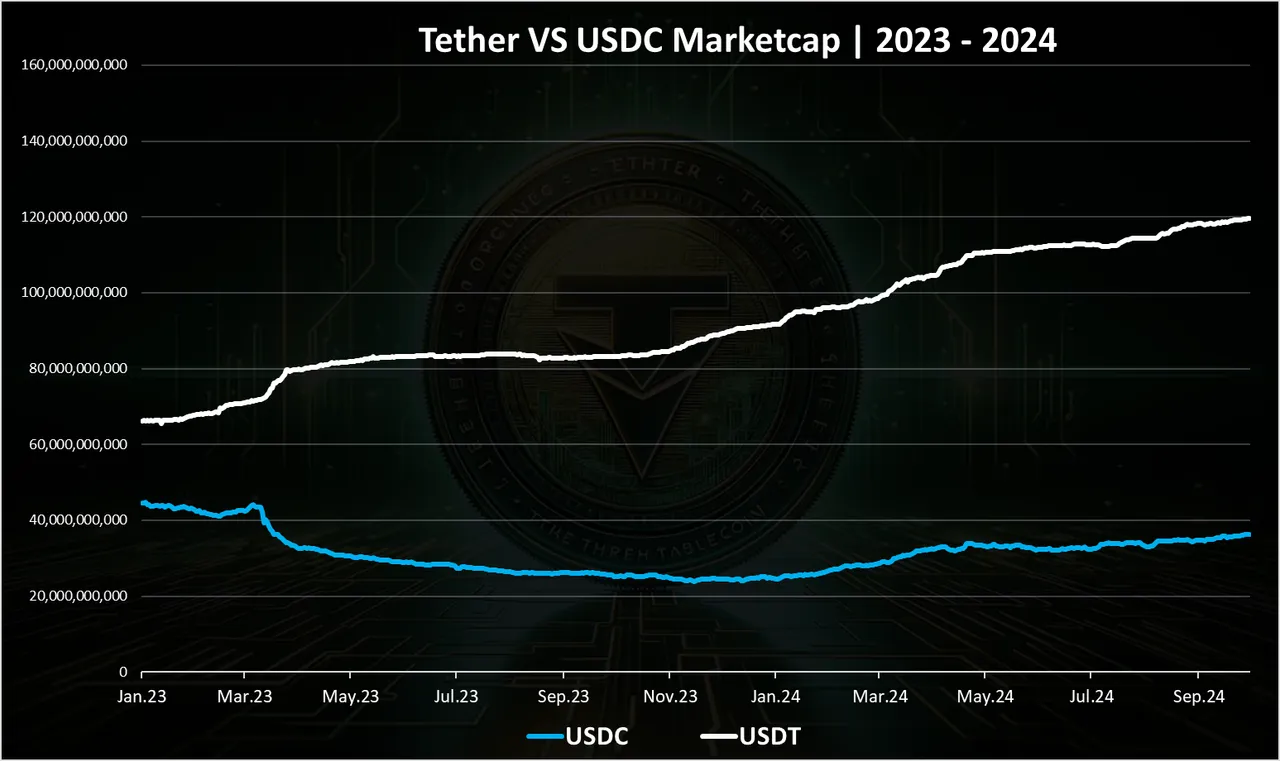
As already mentioned these two are moving almost in opposite directions up to recently.
March 2023 was the month with the most volatility when USDC dropped and USDT increased. Since then, USDC kept going down and it seems to be bottoming out around the 25B mark.
In the last period both of the coins have increased their market cap, although Tether is growing much faster.
USDT is now at 120B while USDC at 37B.
The market share of these two looks like this:
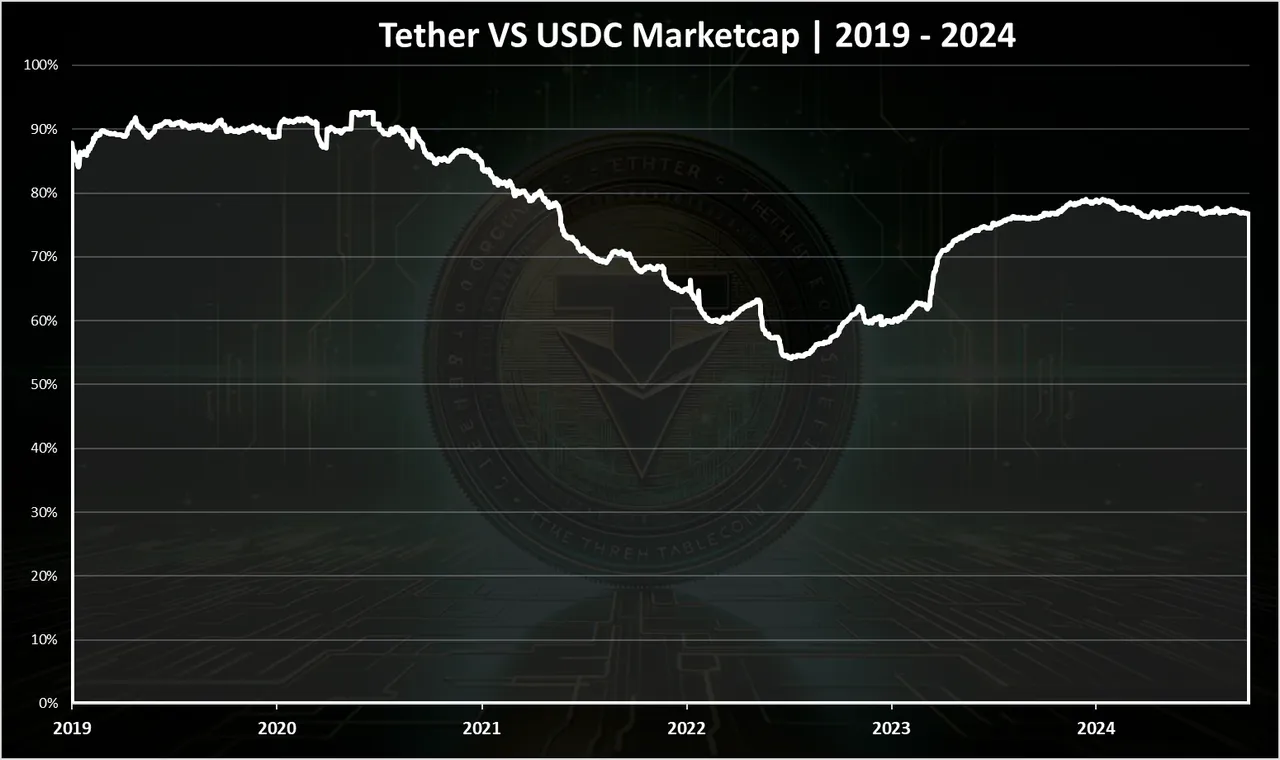
Tether was slowly losing its market share to USDC up to 2022. Then in 2022 it started gaining again and spiked a lot in March 2023 and since then it has kept its market share relatively stable against USDC around the 78% mark.
All the best
@dalz