
Howdy Steemers,
Long time no Steem!
I have not been an active part of the Steem community for a few months.
I'm a full-time Real Estate salesperson and I also decided to take trading the stock market more seriously so I took a break from Steemit.
Blogging can be very tedious if you're a "quazi-perfectionist" like myself.
Enough with the back story....let's get to meat of this post.
I like to post about my trades (even if there is no audience paying attention) because I feel posting/sharing helps keep me accountable to my goals/plan and I also like sharing technical analysis on stocks. This pushes me to further my study of trading, think deeper about my trades and trading and it makes me strive to be as accurate as possible with the information I put out in these Steemit posts.
With that being said, my most recent trade and the only trade I am currently in is a bullish directional trade on Tesla (TSLA).
On July 5th TSLA broke a key support level and slightly entered into bearish territory.
On July 6th TSLA gapped down -40.90 points. This gap down landed right on the 100 MA on the daily chart (red line) which usually is an area price will test before continuing the longer-term bullish trend, resuming the shorter-term bearish trend or moving sideways/neutral.
(see chart below - yellow arrow is pointing to the June 30th sell-off candle and the red candle is pointing to the gap down below the 350.62 support level on July 5th)
[Tesla (TSLA) Daily Chart]
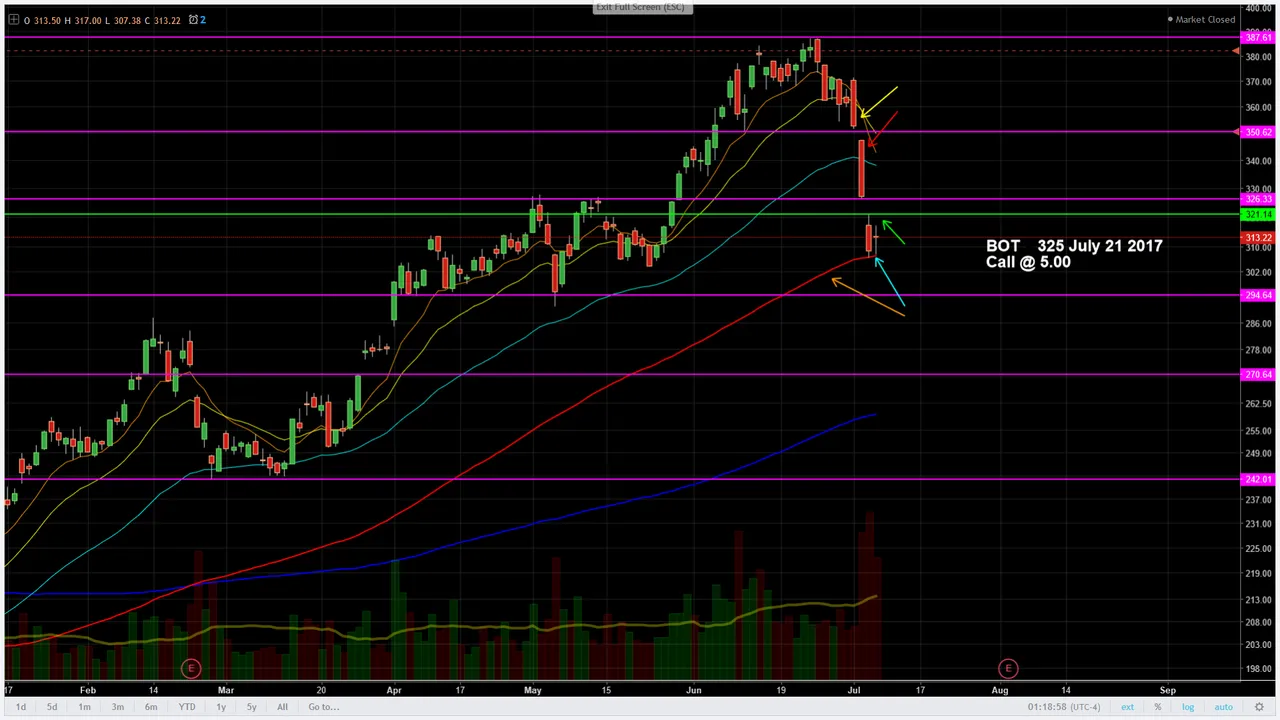
On July 7th, TSLA's price did not break below the 100MA and formed a doji candle.
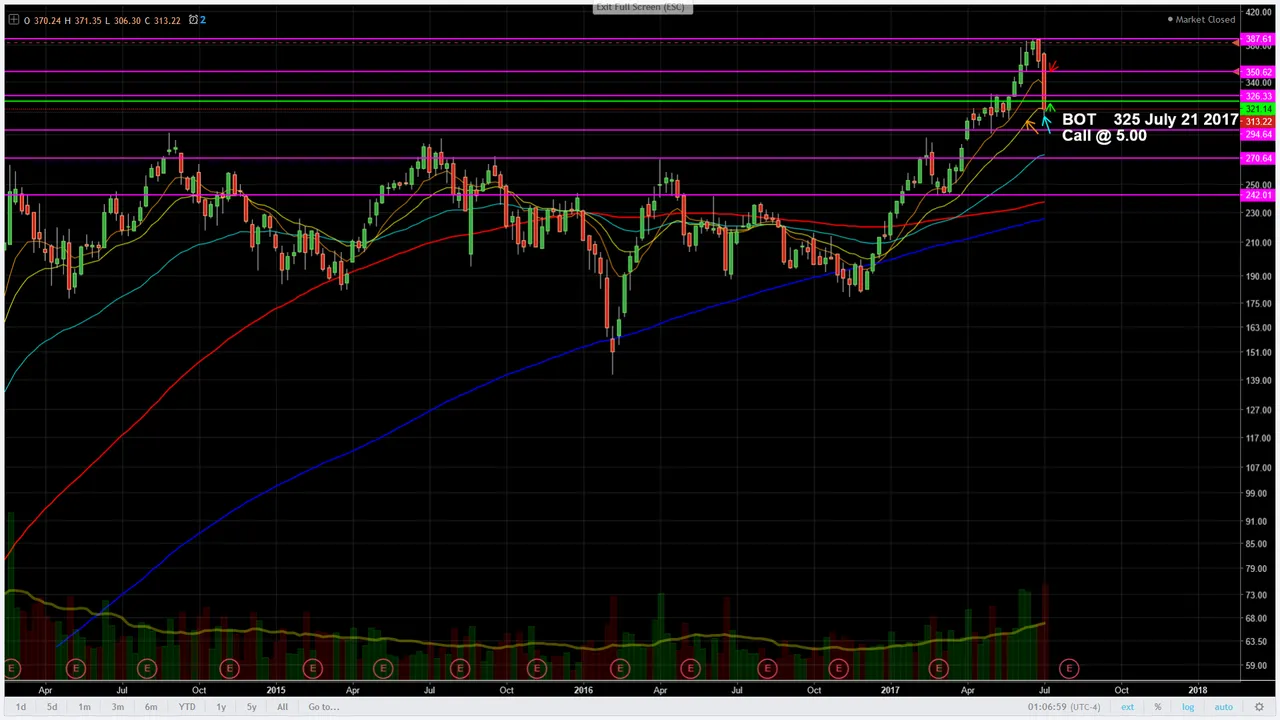
I checked the weekly chart as well and noticed TSLA's price was also resting/testing at the 20EMA (yellow line). (see chart below - baby blue arrow is pointing to support on the 100MA)
[Tesla (TSLA) Weekly Chart]
I entered this trade on July 7th
Trade Profile:
Call Option
Strike - 325
Expiration - July 21
Entry - $5.00/contract
TSLA's recent sell off combined with the stock's price currently testing/resting and showing support on the 100MA (daily chart) and the 20EMA (weekly chart) leads me to believe there is a high probability that price will bounce bullish. Traders who were short July 30th - June 7th will most likely take some profits off the table and long term investors may look at this recent TSLA sell off as a discount and buy the stock - causing the stock to rise higher. I think the stock will face some resistance/profit taking at the 326 and 350 price levels if the stock does bounce bullish on Monday (today a.k.a. 7/10).
If TSLA does bounce today another potential entry with options or stock is 321.14/share with a stop-loss at the most recent swing low 306.30/share. If TSLA's price breaks above 320.79/share then a bullish morning star pattern will have formed. (see photo below - green arrow is pointing at the potential entry on a morning star reversal pattern.)
[Tesla (TSLA) Daily Chart]
If the stock continues the shorter term bearish trend and breaks the 100 EMA - price may test/find support at the 290 price level before going lower.
This is my take on TSLA and the trade I am currently in - let's see what the market does today!
Stay tuned for updates regarding my trade on TSLA and future trades!
Until next time,
- Ford Mogul
Thank you for reading! If you found value in this post and would like to support this blog please up-vote & resteem.
Follow for more great content! (steemit.com/@fordmogul)