@EpicDesigns Technical Analysis Report 3/17/2018
Coin/Asset:
Bitcoin/USD
Current Price:
-$7970
The Technicals:
Time Analysis:
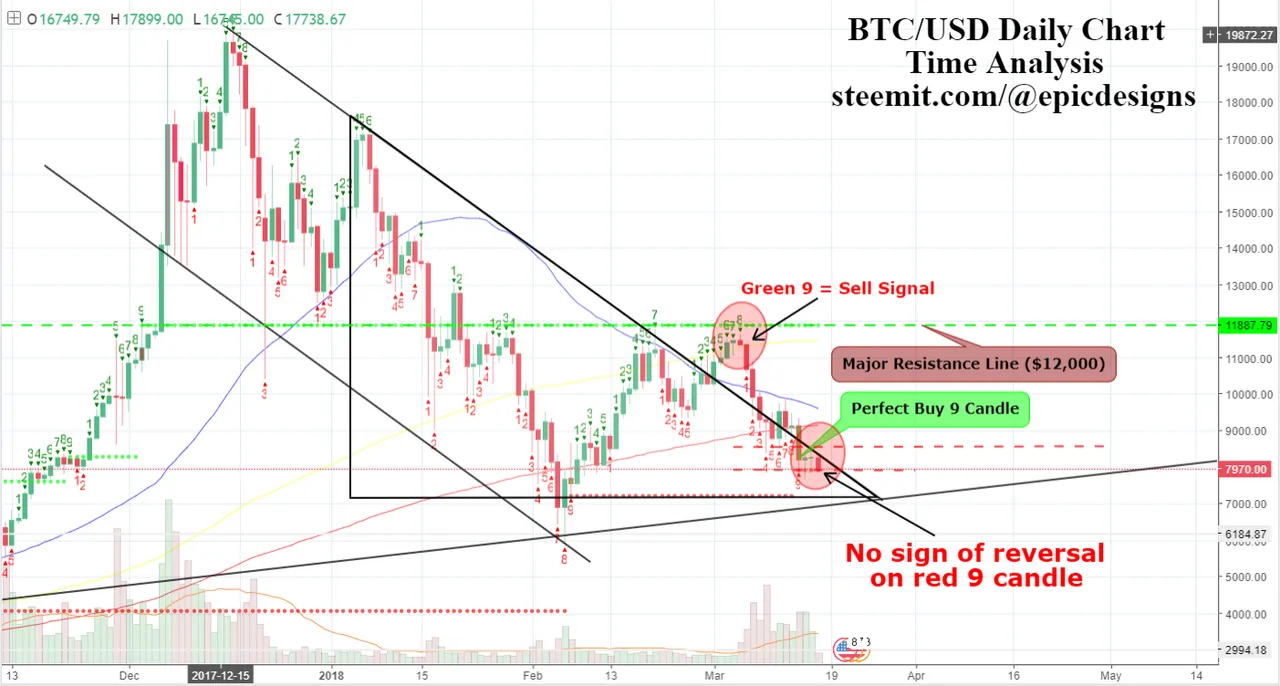
Bitcoin's price is still going down folks... The ninth day red 9 candle my time indicator plotted told me a bullish reversal was possible starting with yesterdays candle. I watched yesterday as prices hovered around $8200 for most of the day. Today being the third candle from the 9th daily setup candle, prices are still down. Will a price flip happen? Or will we see another 1-9 day bearish cycle?
I'm expecting another fairly large dip or two in the price before another buy setup can begin to form. Furthermore we're back in this descending triangle pattern drawn previously. It's not totally unrealistic that prices could drop even farther than $5,000 if this triangle gets broken to the downside. With all that being said I don't think right now is a safe time to stock up on more BTC/USD, stay tuned I will keep you guys updated with my time analysis and let you guys know when another perfect buying opportunity comes up.