Let's take a look at 1 year price chart for BTC to illustrate the current edge that exists.
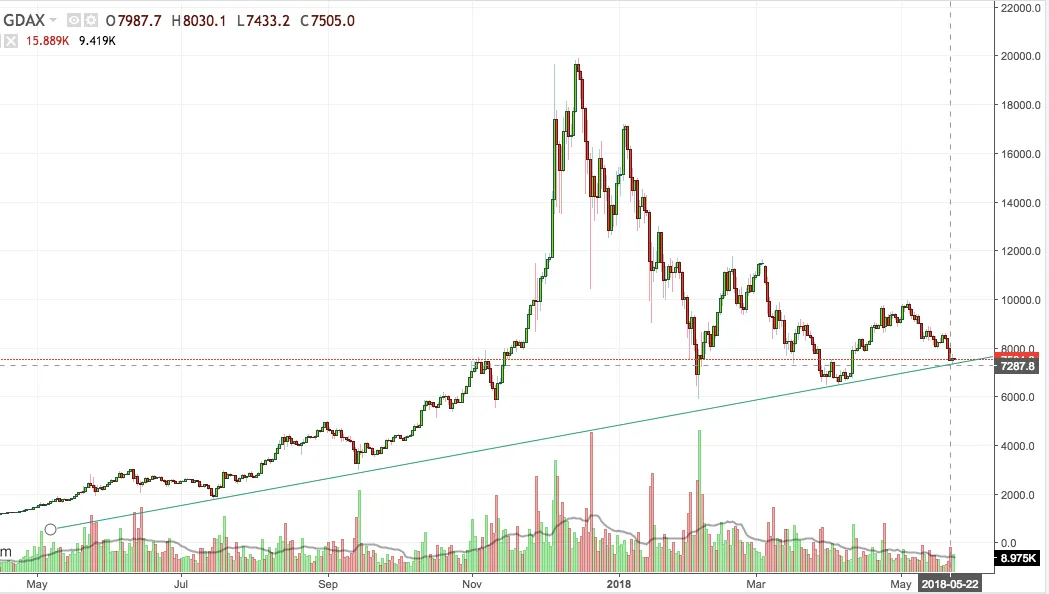
BTC/USD is in long term uptrend and just make a trend line touch at ~7300. It has bounced near this trend line on a handful of occasions during the last year. It has never closed under.
Volume is weakening on each of the three major selling waves which have occurred since early Jan., indicating the sellers are running out of gas.
Getting long here. Looking for buying on volume to add.
Legal Disclaimer: I am not a financial advisor nor is any content in this article presented as financial advice. The information provided in this blog post and any other posts that I make and any accompanying material is for informational purposes only. It should not be considered financial or investment advice of any kind. One should consult with a financial or investment professional to determine what may be best for your individual needs. Plain English: This is only my opinion. This is not advice nor recommendation to either buy or sell anything. It's only meant for use as informative or entertainment purposes.