Marginal utility of money:
The marginal utility of money is the utility that reports an additional unit of money.
The marginal utility of money is the profit or utility that we obtain when we have an additional unit of money. It is a concept similar to the marginal utility that the goods or services report to us, nothing more than in this case the utility obtained is indirect. That is, we do not obtain utility from money itself, but from what it can buy.
Marginal utility of decreasing money:
The utility that gives us an additional unit of money is decreasing. While we have few units of money (maybe we are very indebted), an additional amount of money will bring us great relief and satisfaction.
However, as our income increases, additional amounts of money will be welcome but will deliver a much lower utility than when we had very little income. In the extreme case, if a person is multimillionaire, an additional amount of money will be good for him but the profit obtained will be quite small. That is why we say that its marginal utility is decreasing.
Risk aversion:
The fact that the marginal utility of money is decreasing is related to the fact that most people are adverse to the risk of losing money.
Losing a quantity of money has a greater negative impact than earning the same amount of money. Considering the above, in fair bets or games, where the expected value of the gain is equal to the safe amount if it is rejected, risk-reluctant people will prefer not to play.
Insurance and marginal utility of money:
Given that the marginal utility of money is decreasing and that in general, people are reluctant to risk losing money, there is an insurance market. People are willing to pay a certain amount of money in order to eliminate or reduce the risk of losses.
Total utility:
The Total Utility corresponds to the total satisfaction that an individual obtains for the consumption of a certain amount of goods or services.
The total utility is calculated as the sum of the profits that the consumption of a certain amount of goods or services reports to us.
The total utility curve (as we can see below) has an ascending behavior until it reaches a saturation point where it begins to fall. The shape of the curve is explained by the fact that as we consume additional units of a good or service each time we value them less, until we reach a point where we no longer want to consume more.
Example of total utility:
An example that clearly reflects the behavior of total utility is the consumption of food. Let's suppose that we are very hungry and we go through a pastry shop. The first cake we eat will give us a high utility as it calms our hunger. The second cake we still enjoy but we are not so hungry anymore. The third cake gives us little use since we are filling up. The fourth cake is already becoming too much. Definitely the fifth will no longer give us any use and could even harm us.
In economic terms we say that the total utility is the utility that gives us the consumption of all units of the good (in this case 5 cakes). The marginal utility, on the other hand, is the utility that each additional unit of the good gives us (the utility of each additional cake that we are consuming).
The total utility is increasing when the marginal utility is positive. The latter presents a decreasing curve, each additional unit gives less utility than the previous one and can even become negative (when the consumption of an additional unit hurts us).
When the consumption of an additional unit no longer provides utility to the consumer (the fourth unit of cake leaves us saturated) it is said that we have reached the point of saturation.
Total utility graphs:
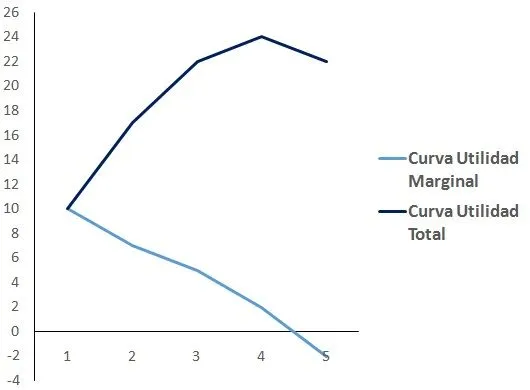
In the following graph we can see the curves of total utility and marginal utility of our example. As we can see, the first one is increasing until we consume the fourth cake (saturation point) where it starts to decrease.
The marginal utility curve is always decreasing, becoming negative in the fifth pie (after the saturation point).
Marginal income:
Marginal revenue is the increase in total income when one more unit of product is sold. As this unit is sold at the market price, for a company in free competition the marginal revenue is equal to the price.
It can be kept constant, but it is normal to follow the law of diminishing returns and the more units produced, the lower the marginal revenue. A company will find it profitable to produce more units even if the marginal revenue is decreasing until it equals the marginal cost. Marginal revenue is calculated by dividing the change in total revenues by the number of additional units. Let's see an example:
A company that manufactures dolls has a total income of 0 euros when no doll is produced. However, the income is seen from the production of his first doll: if it costs 15 euros, the marginal revenue would be:
If the income of the second doll is 10 euros, the marginal revenue obtained through the production of this second doll would be:
Through marginal revenue, the company compares the amount that each additional unit adds to both total revenue and total cost. Similarly, if the income of each additional unit is greater than its marginal cost (which measures the rate of variation of the cost, divided by the variation in production), the company must produce said unit or, otherwise, they will reduce their benefits or the losses will increase.
Generally, in the initial stages of production, marginal revenue is usually greater than marginal cost and, therefore, it is profitable to continue producing within that same dynamic. However, in later phases, when production is relatively high, marginal costs can grow more than marginal revenues, so the organization should avoid production in this line.
When the maximization of the company's profits is sought from a competitive perspective, as in the other market structures, the marginal approach is used, so that in the short term benefits are optimized or losses are minimized, producing the level of product in which the marginal revenue is equal to the marginal cost.
Finally, it can be said that the relationship between marginal costs and marginal income is direct, since an increase in production in one unit generates an immediate increase in the cost of production. Also, this increase in a productive unit also generates a growth in marginal revenue, which will be favorable until reaching the point of equilibrium. Once this limit has been crossed, the production of an additional unit would generate a decrease in revenues due to the growth in the cost of this additional production.