
What happens to lost and forgotten knowledge? That is to say, where do the studies that are not recognized in peer-reviewed journals go to languish? Many research projects are never formally published because they lack mass appeal, fail to show significant results, or are not held to the same rigorous standards that these journals require. This does not mean that the studies are worthless or that the information is necessarily invalid; all objective data has some worth as a snapshot in time.
The studies discussed in this article are real research projects conducted in Como Park, a large urban park in Saint Paul, Minnesota. The studies all center around a shallow lake in the park known as Como Lake. It is a low point collection basin for the park and the water quality of the lake is impaired like many urban waters. The studies focus on wildlife and collectively examine the turtles, macro-invertebrates, and birds in the lake and surrounding woodlands.
Each study was performed by a different group and each has a unique style and amount of detail. The studies all have a spatial component, but none of them have been digitized or visually displayed aside from a simple map that appears in two of the studies. The chances of someone randomly finding the studies hidden on the local government website, reading through them, and gleaning any sort of useful information seem relatively unlikely. However, when the data is summarized, digitized, and displayed spatially, it becomes accessible to a much larger audience at a glance.
Bird Study
 Some adorable baby birds | Source
The Bird Study is a 7-page word document released by two community members in 2006. The study discusses data collected by several volunteers who walked a series of circuits through the park. The objective was to document the number of species and individuals that are found in different parts of the park and describe the habitats encountered. There are no images, maps, or diagrams with the study, but the seven different walking routes are described in sufficient detail to extract a rough polygon encompassing the observed areas.
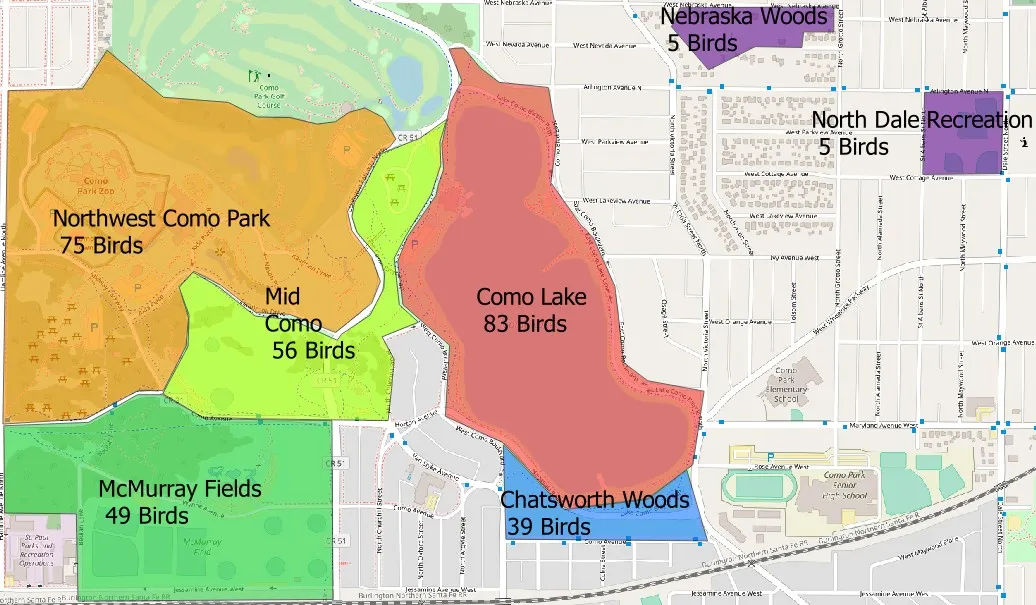 Graphic summarizing the finding fo the Bird Study with color-coded labeled polygons showing the best (warm colors) and worst (cool colors) places to observe birds.
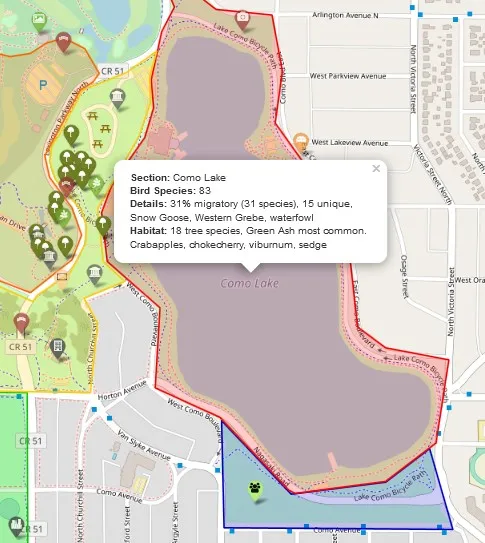 Web-based version of the Bird data showing an interactive popup that summarizes the relevant information for each study area.
Numerical data about the number of species and text data regarding the species names and types of vegetation along each path are also included in the document. This data was appended to the polygon shapefiles defining the study areas. The numerical data on species counts is used above to color-code the polygons and highlight the areas where the highest concentration of bird species can be found.
Unfortunately this is as far as the Bird Study goes. It includes a limited amount of observational data collected by different people at different times, making data standardization difficult. The study areas are different sizes and the authors conclude that this is main cause for the difference in bird numbers. The spatial assessment seems to mostly agree with this conclusion, yielding a blueprint for an improved future bird study with data normalization.
Bug Study
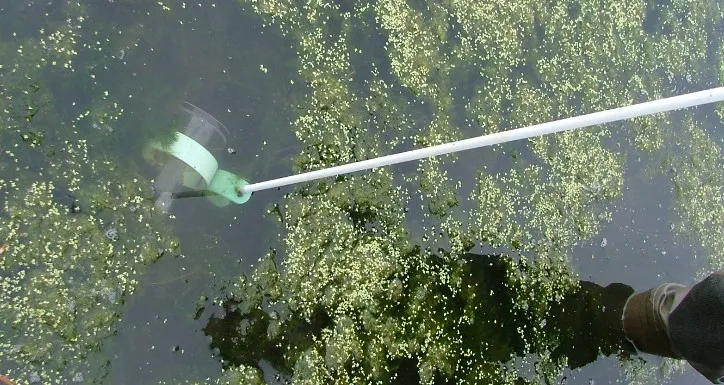
Photo from the Bug Study showing the process of macro-invertebrate sample collection.
The Bug Study is an 11-page word document that was produced in 2007 as a partial requirement for the grant that funded the study. It is more elaborate than the Bird Study and comes complete with photos, an area map, several pie and bar charts, and a more clearly defined set of methods. The objective was to look at the species diversity (taxa) and density of macro-invertebrates around the lake as an indicator of water quality. In the study, six sections of the lake near the shoreline were sampled monthly for five months. The number of unique macro-invertebrate species and the total number of macro-invertebrates in the samples were recorded and included in summary charts.
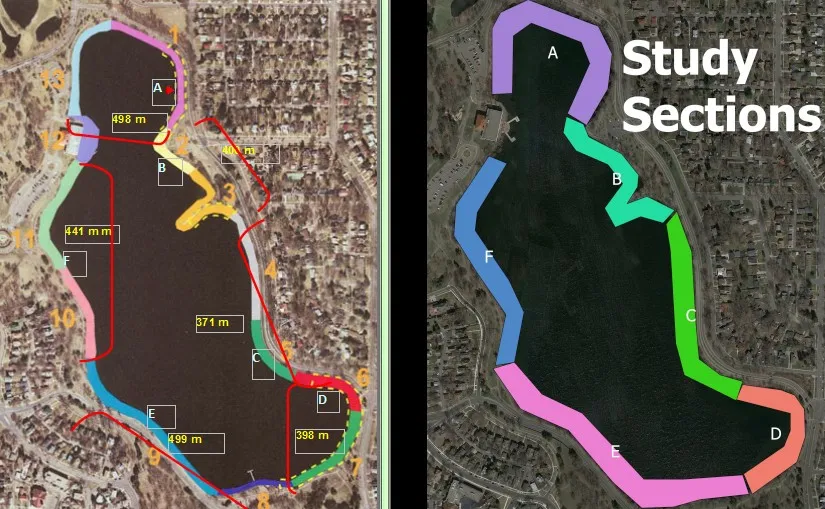 Map included with the study (left) and inferred GIS polygons (right) for the study areas.
The spatial component of this study was traced on a map included with the study. The six areas outlined on this map were traced as rectangular polygons to encapsulate the randomly chosen shallow water sampling locations from in the study. Both the taxa and total count data is numerical and can be used as the color ramp categorized classification key. Since sampling was done over the course of 5 months, this data also has a temporal component that can be made into an animation.
 |  |
At first glance, the seasonal variation in macro-invertebrate density and location is apparent. Rather than one section of the lake being the 'hot spot', the most productive macro-invertebrate areas change with the months. Only by averaging the monthly data do the best areas to find macro-invertebrates become more clear.
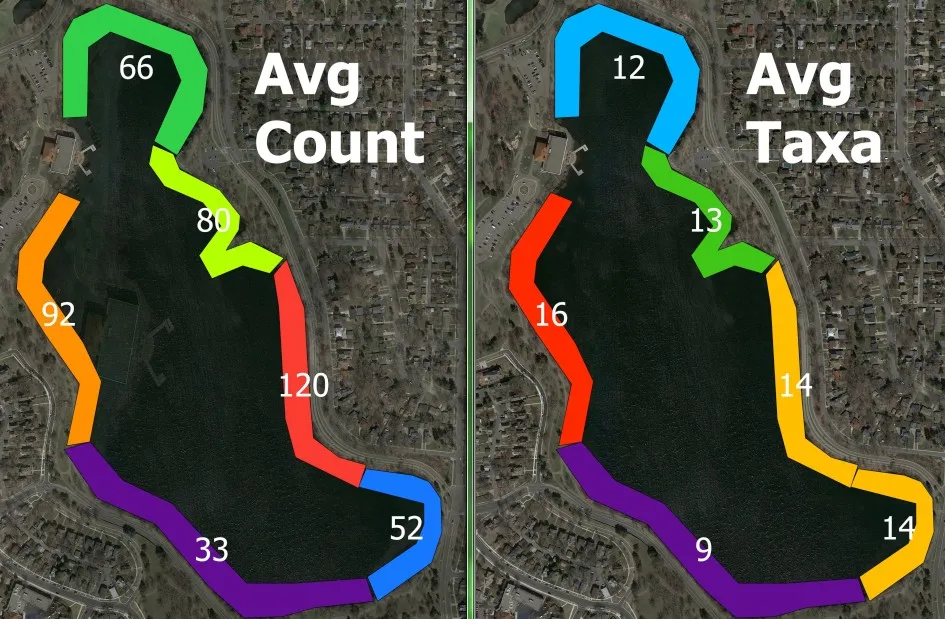 Color-coded look at the average values for count and species diversity.
Without question, the east and west sides of the lake have the highest concentrations of both macro-invertebrate species and total organisms. The bay at the north end of the lake also serves as a decent habitat for macro-invertebrates, while the south end clearly has the lowest number. This finding suggests that the water quality on the south side of the lake is worse than other shores, though part of this effect may be due to the decrease in direct solar radiation on north-facing slopes in the Northern Hemisphere.
Turtle Study
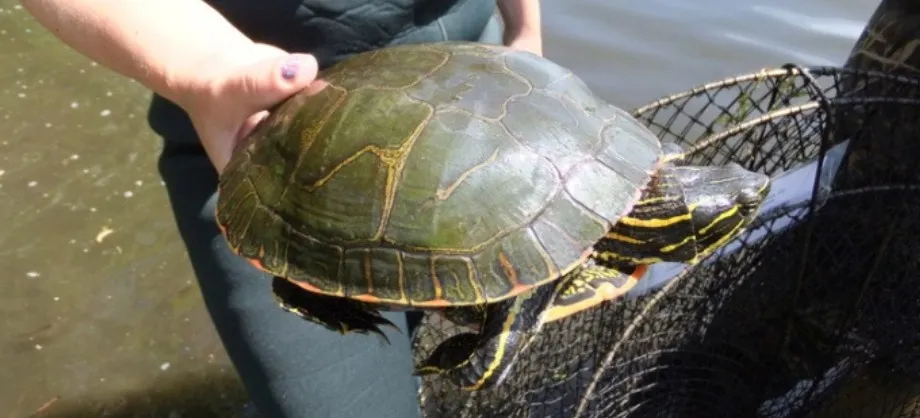 A photo from the Turtle Study showing a large painted turtle being removed from the trap to be measured.
The Turtle Study is the most comprehensive study of the three. It is a 51-page PDF that was authored in 2011 by the Como Community Council, although the majority of the document is comprised of photographs and raw data with no figures and only a couple summary tables. Although a simple map of the study area is included, no attempt was made to visualize the results of the study spatially. Using the map, the shoreline sections of the study were traced as polylines to digitize the data. The project is a two-part study of the quantity and dimension range of turtles in Como Lake.
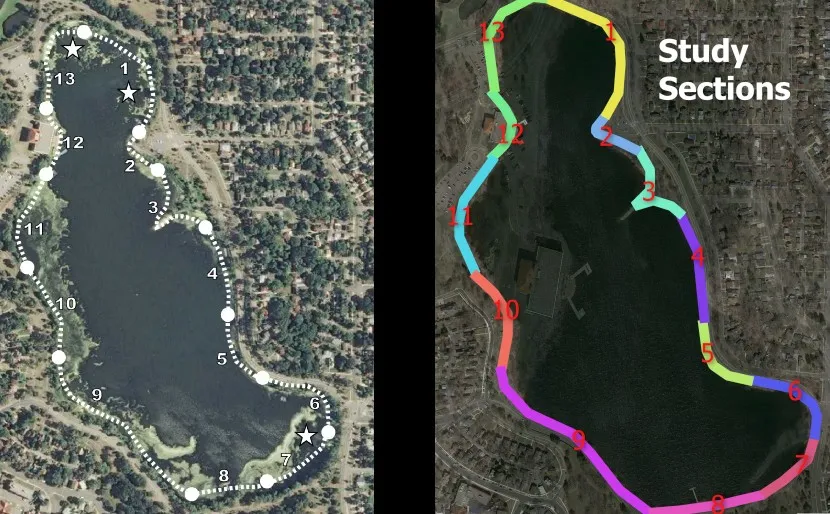 The map included with the Turtle Study (left) and a GIS line representation of the study section data with random colors (right).
The first part of the study is similar to the Bird Study in that is an observation-based analysis of the number of turtles that sun themselves along the lake shore. The study differentiates by species and identified both painted and snapping turtles. Observations were made by volunteers over the course of 85 days by walking around the lake. The lake was divided into 13 different sections and the number of turtles observed in each section each day was recorded. A total count over the course of the study was extracted from a table and appended to the section line polygons. The same color ramps used above were applied to visualize the number of painted and snapping turtles observed in the sections.
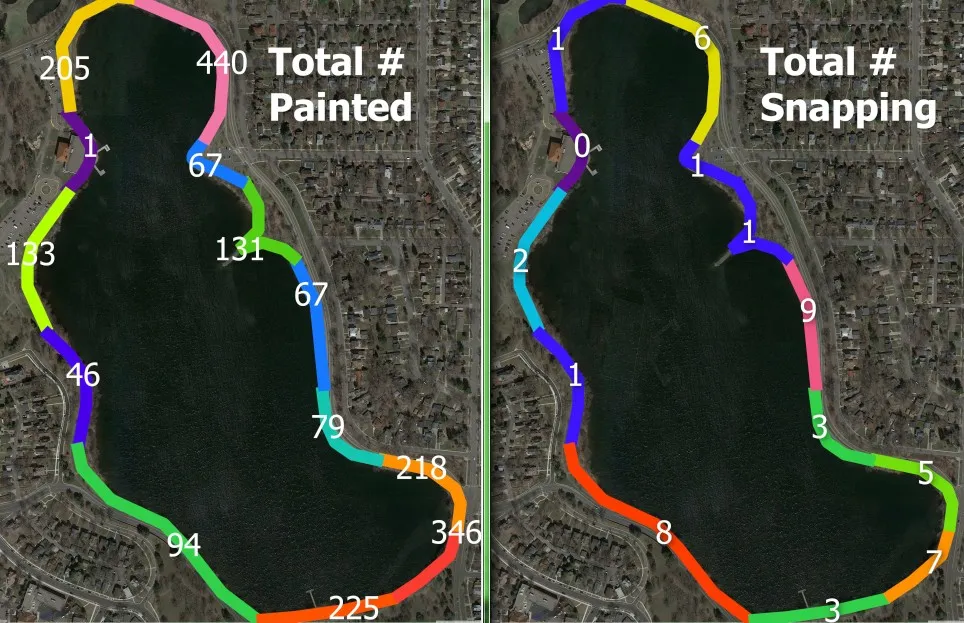 Warm colors represent popular turtle basking areas, cool colors the contrary.
In this study, painted turtles seemed to predominantly prefer sunning themselves in the bays at the north (sections 1 & 13) and south (sections 6-8) ends of the lake. The peninsula jutting out in the center of the lake (section 3) was also a popular spot, but the areas where macro-invertebrates thrived do not seem as popular with the turtles. Snapping turtles are much less common and they were most frequently spotted on the beaches in sections 4, 7, and 9. If you hate turtles, your safest bet is to visit the manmade docks in section 12 where only one turtle was spotted during the study. Note that the observed numbers in this part of the study do not necessarily represent unique turtles, as observations were made on different days from a distance and without identifying individuals.
The second part of the study involved setting three turtle traps in different parts of the lake and measuring the diameter and weight of the turtles recovered from the trap. The study authors received a permit from the Minnesota DNR to trap and analyze turtle attributes. The locations of the 3 traps can be seen on the study map, but the turtle size measurement data was not spatially summarized in the study and was not included in this analysis.
Other Como Data
The studies addressed in this article are not the only studies available for Como Park. At the very minimum, there are nearly 50 years of fish population surveys available from the DNR, and multiple watershed and water quality studies from the Capital Region Watershed District. These studies have also been summarized and compiled as layers on an interactive map that will soon be available on the District 10 Como Park website! I may present a similar GIS analysis of these studies in a future post. I bet your city has similar data just waiting to be uncovered!
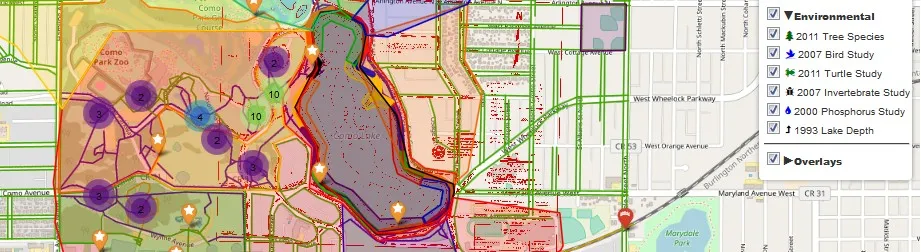 A sneak preview of the upcoming D10 Map!
Closing Remarks
Although these studies may lack some of the requirements for being published in a peer-reviewed journal, they are generally objective studies that provide a unique temporal snapshot into the state of wildlife in Como Park. Many hours of volunteer efforts went into collecting the data for these studies, and no comparable studies for this lake have ever been conducted that I can find. By compiling the text and summarizing the pertinent data into a few polygons and graphics, the information can be quickly and easily digested by a much larger audience than is likely to read through the studies otherwise.The lack of spatial analysis in the earlier studies might be to the gradual adoption of GIS into different fields. As more people realize the power and potential of spatial data, one can hope that the free and transparent dissemination of all types of information becomes commonplace. Putting data on the blockchain is a great start!