Testing Top of the Trend line
Last week we saw that price was testing the top of the trend line thoroughly, but also creating a flag with a potential bearish move back towards the $16-$18 where the trend line developed. There was not nearly as much risk as tradres believed, as there were 2 significantly tested trend lines that price would have to break in order to truely fall under $16.
When trading using trend lines as a core Technical Indicator - let the candles close to confirm a clean break of any wedge or channel formation before entering a trade, and use prior trend lines as support/resistance structures and reaction points.
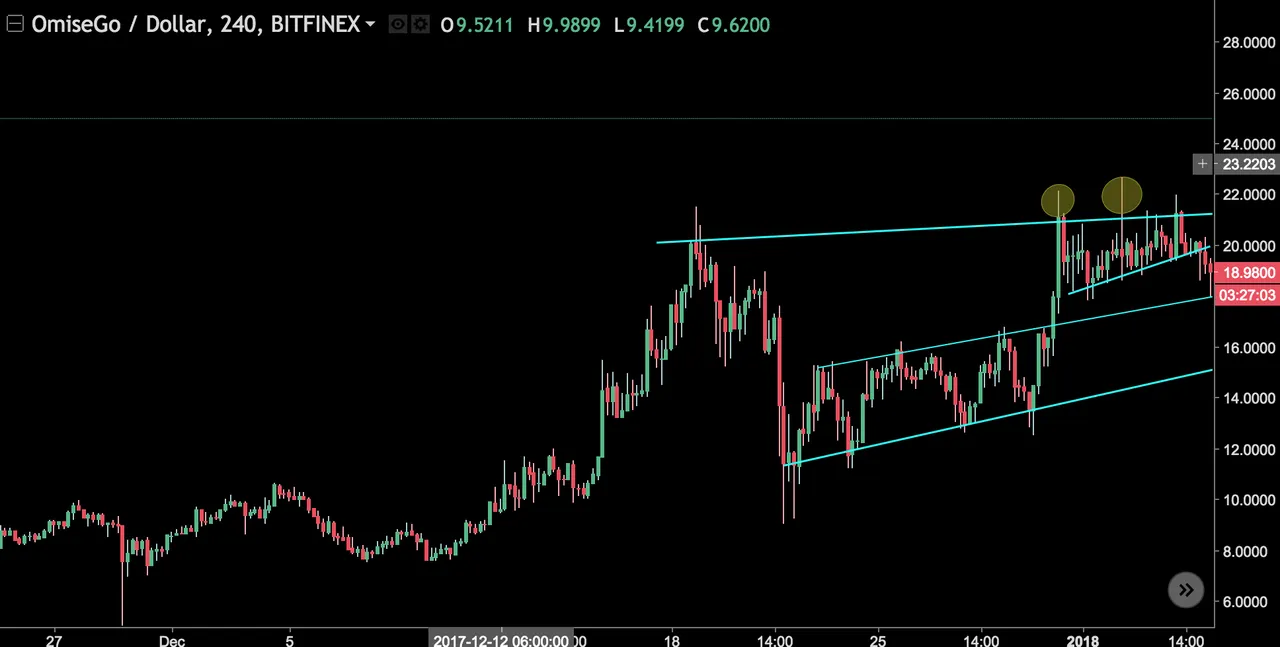
Price broke new Highs
Eventually, price did break the intial trend line and test the secondary trend line, but there was not enough momentum for it to break and eventually it broke into new highs, currently pushing $25 with no signs up slowing down. Eventually we may see a retest of the top end of the prior structure @ $22-$23 before the next rally. As of now - sit back and watch it ride, and buy in at the next mini-correction when price begans testing support levels.
This minor fall my have fooled some traders to think that price will fall to the bottom of the larger trend line, however if you extended the prior structure, it would have been wiser to have price close a candle under that trend line before shorting the coin, to avoid the additional risk of price rallying towards the higher structure level.

Follow me for more crypto trading updates based on simple Technical Analysis!