Last year I made an epic post that talked about the demographic outlook and traffic analysis of Steemit. You can check it out here:
Since Then, Steemit Has Grown Dramatically.
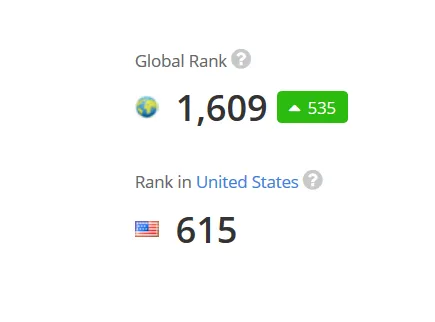
If you check out the post above, Steemit was the 14,411st most popular site on the internet. It's now ranked 1,609 on the entire internet, and 615 in the USA, which means Steemit has grown ridiculously over the last year.
Overall Steemit Popularity

I'll revisit these statistics again next month to see what changes. It's my hypothesis that growth will continue at a slow pace, only because Steemit is already ridiculously popular.
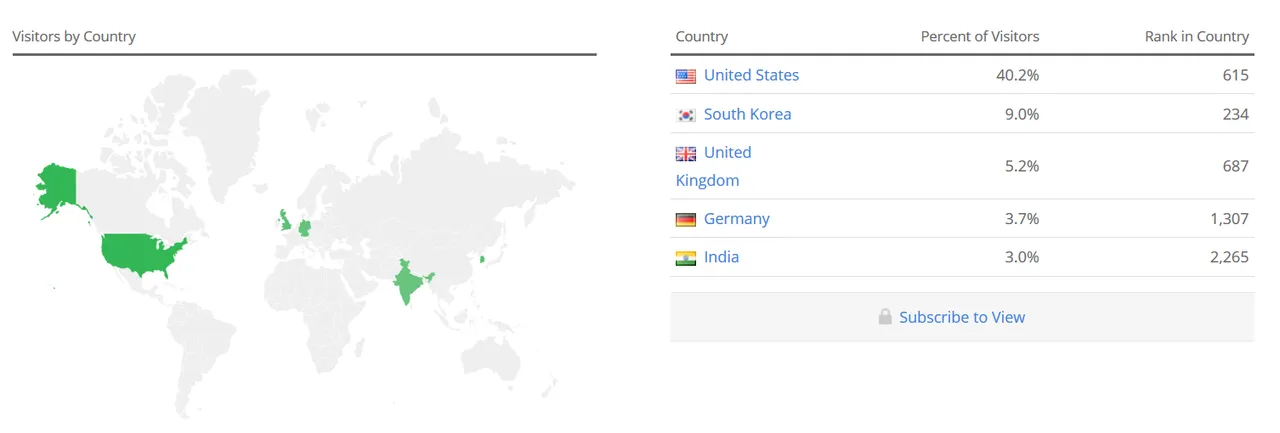
Steemit Audience Geography

These statistics are hugely interesting. Last year when I conducted this same analysis, USA traffic only made up about 16.8% of website visitors, and today as of January 03 2018, USA traffic makes up an astounding 40.2% of website traffic. That's a massive increase of 23.4% USA users.
Steemit Audience Demographic Data

One statistic that immediately jumps out at me regarding Steemit's audience demographic, and the biggest change I notice since last year's analysis, is that upon Steemit's launch, there were actually less College Educated Users. I'm not sure why that is, but over time there has been a statistic increase of College Educated Users. (Do you have a hypothesis as to why this may be? Fascinating find, in any event).
Steemit Audience Engagement

Interestingly, the only downward trend in comparison to last year, is Steemit's bouncerate, daily time spent on site, and daily page views per viewer.
I'm not sure what can account for this, other than the simple fact that end users are statistically speaking, spending less time on Steemit over a span of about 8 minutes. (Last year the average user spent an average of 14:37 minutes on site, as of this updated data, the average end user spends an average of 6:13).
If I had to guess why this is the case, I would assume that upon Steemit's launch, the average end user was a diehard blogger and more interested in devoting larger quantities of time on the site. As the site became more popular, the quantity of casual bloggers increased, thereby decreasing the average time spent on site, and also the daily time spent on site.
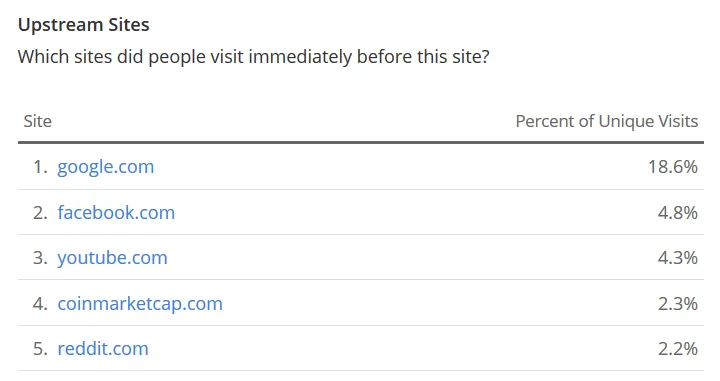
Steemit Audience Browsing Behavior (What Websites Do Users Frequently Come From?).

Interestingly, this chart has largely remained the same as of last year, with the top 3 referrers being Facebook, Google, and YouTube. Reddit has also maintained its space as a significant referrer.
Steemit Interest Over Time

As you can see, the interest of Steemit has been quite significant over the last year or so, and I project the fascination and interest of the Steemit platform to continually increase well into the next couple of years, especially if cryptocurrencies continue in their escalating values.
Source And Works Cited
http://www.alexa.com/siteinfo/steemit.com
https://www.google.com/trends/explore?date=all&q=steemit
Thanks For Checking This Out! You Rock!
If you appreciate this content, then please considering following me @rook. And be on the lookout for future analyses that I intend on publishing every quarter, if not monthly.
Until that time, please have a beautiful day, and enjoy your 2018!