There has been much talk among my Steemit peers that the platform seems a little quite the last two to three weeks. There is a feeling that the activity levels have dropped off somewhat.
Other authors have touched on this in the last few days such as @inquiringtimes with his article 'Are you experiencing Lower Pay on your posts? Is someone picking on you?'
And with @mikepm74 his article 'Has Steemit been slow lately? If so, Why?'
I myself was feeling the same with regards to my posts. I spent 7 hours on an analysis on Sunday which is included in this post, and it only earned $5.12. I'm very surprised with the low engagement and payout on this post. Feel free to check it out 'Positive or Negative? The Data behind the Steemit Trending Page'
https://steemit.com/steemit/@paulag/positive-or-negative-the-data-behind-the-steemit-trending-page-steemit-business-intelligence
For those of you that know me, I don’t normally complain about pay-outs, but when I see my own dropping steadily, then I have to do something.
That something happens to be analyzing the data. With all of this in mind, I have had a good look at the data on a week to week basis from the start of 2017. There was quite a lot involved in this analysis, but I really wanted to see as much activity as I could.
To carry out this analysis, as always, I have connected Power BI to Steemsql held and managed by @arcange
General Activity and % Change on Previous week
Below are 6 charts. Going down the left column of charts first we have
No of Comments (bars) % Change on Previous weeks (line). The number of comments per week peaked in week 26 and has been on a slight downward trend since
No of Posts (bars) % Change on Previous weeks (line). The number of posts also peaked in week 26, however there is a rather consistent posting trend each week.
No of Votes (bars) % Change on Previous weeks (line). The number of votes made each week has been increasing since week 18

In the right column of charts we have
Total No of Transactions (bars) % Change on Previous weeks (line). There is a slight upward trend in the total number of transactions taking place each week on steemit
No of New Accounts (bars) % Change on Previous weeks (line). The number of new accounts peaked at week 24 and has been on a downward trend since then.
Total pay-out – posts and comments (bars) % Change on Previous week (line). Total pay-outs peaked on week 25 with a sharp decline to week 29. From here the decline in pay-outs has continued but at a much slower rate. The trend is remains a downwards trend.
% Changes on Previous weeks
Plotting the % change on previous week for Comments, No of Votes, Posts and Total transactions it is clear to see that the % changes are very much in line with each other. However with the number of new accounts the % change was off the scale and is plotted in the second chart below

Some averages
The first chart below, plots the number of Posts (bars) and the Average comment per post. We can see that although the number of posts is rather level each week, the average number of comments per post has reduced from 5.5 in week 24 to only 4
The average number of votes per post peaked in week 8 at almost 20. This dropped to 2.5 in week 26. The trend has since changed to a more positive trend and is now about 4 votes per post.

In the chart below we can see the trend on a week by week basis for both the average number of votes per post and average comments per post. It is interesting how these have almost come into line in the last couple of months.

As the number of votes are on the increase, but the average number of votes per post is way down on its peak, it would suggest that curators are voting for a wider base of authors.
Year to Date Curves
The first chart below plots the no of comments year to date (ytd), no of posts ytd, no of posts and comments ytd and the number of new accounts year to date. I found the steepness of the curve hard to judge, so in the second charts shows the same data using log instead on linear.
Now it is clearer to see that between week 19 and 25 the growth was at a faster rate

Presenting this data in a slightly different way it is clear to see the growth in new accounts and total number of votes are closely correlated.

What we know so far
The number of posts and votes weekly are on an upward trend. The number of comments left on posts in on a downwards trend. People are posting, but less people are commenting on these posts. However there are more votes – does this suggest less human activity (i.e. reading and engaging) and more bots?
We also know that the rate of growth has slowed down since week 26. And that the average number of comments, votes and pay-outs have decreased per post.
So on a per post basis things are looking worse, hence the downturn I have experienced. But the overall activity on steemit is on the up.
Pay-outs
Pay-outs seem to be the biggest concern, and the ratio for the drop in votes to pay-out on my posts don’t really correlate with all of this data and I think there is a little more going on with the pay-outs and vote value.
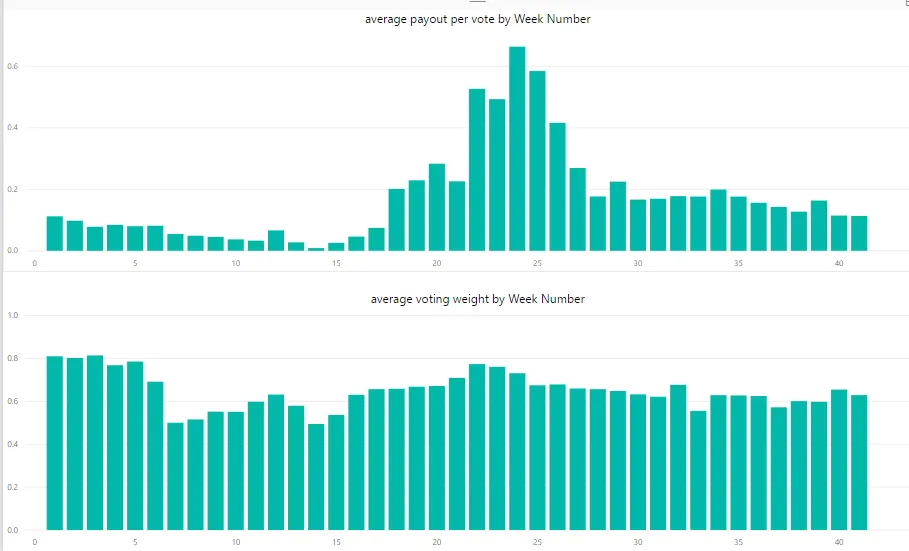
In the first chart below we can see the average pay-out per vote peaking in week 24 at 66 cents. This has declined to 11 cents. This is a reduction of 83% on peak
There are a few things that impact the value of a vote, the current price of Steem, the SP held and the voting weight. The second chart below shows the average voting weight per week. The highest was at the start of the year at 81%. Overall the trend is downwards and we are now looking at 63%. This is a reduction of 22%
Looking at the charts below, first we have the average pay-out per post plotted with the average voting weight. Over the last 12 weeks the fluctuation in voting weight is not correlating to movement in average pay-out per post. This would suggest that there is a reduced SP holding.
The average pay-out per post peaked at $16.25 in week 22 and is now at $2.96. That’s a reduction of 82% on peak
The second chart shows the average pay-out per comment and the average voting weight

Finally I have plotted the total posts pay-out with the average pay-out per vote and the total pay-outs on comments with the average pay-out per vote.
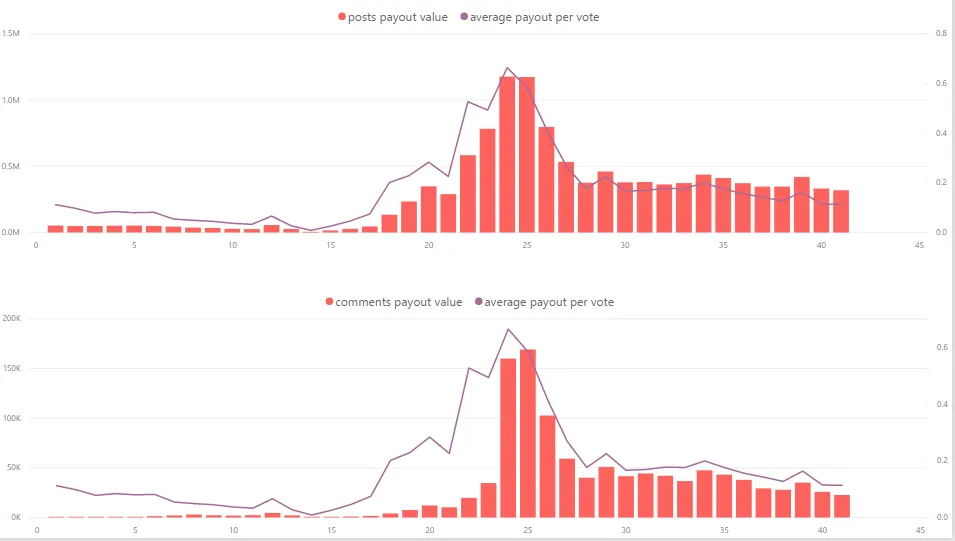
It is very clear to see from all of these visualization that what people are earning now per post, is well well down on the peak. Over 80% down. The average voting weight has decreased 22% on peak but we know the number of votes has increased. So this does not account for the drop.
Steem Price
The Price of Steem and Steem Power are also contributors to values of votes and posts.
Below is the Steem close price chart for 2017. The peak is in week 23. However from mid-july to present the price of steem rests between $1 and $1.50 with the overall trend being a downtrend.

Conclusion
So there you have it. In general Steemit has not slowed down, although there is a question over human interaction over bots. It would appear to me that human interaction is reducing and bot activity is increasing.
This would explain why the platform appears to be less active. For those of us that joined steemit while the price of steem was over $1.50, obviously we are feeling the lower payments. But rest assured this is mostly down to the price of Steem.
People that joined while the price of steem is close to $1 would not feel this as much, in fact every time it rises to $1.50 they are feeling the gain.
If you feel like you are getting less votes and comments per post, well you are. As more people join steemit, votes appear to be spread to a wider audience, however it is not the same story with comments.
I am part of a Steemit Business Intelligence community. We all post under the tag #BIsteemit. If you have an analysis you would like carried out on Steemit data, please do contact me or any of the #bisteemit team and we will do our best to help you...
You can find #bisteemit on discord https://discordapp.com/invite/JN7Yv7j