
🐒 Steem not invested in Steem Power henceforth referred to as : LIQUID STEEM
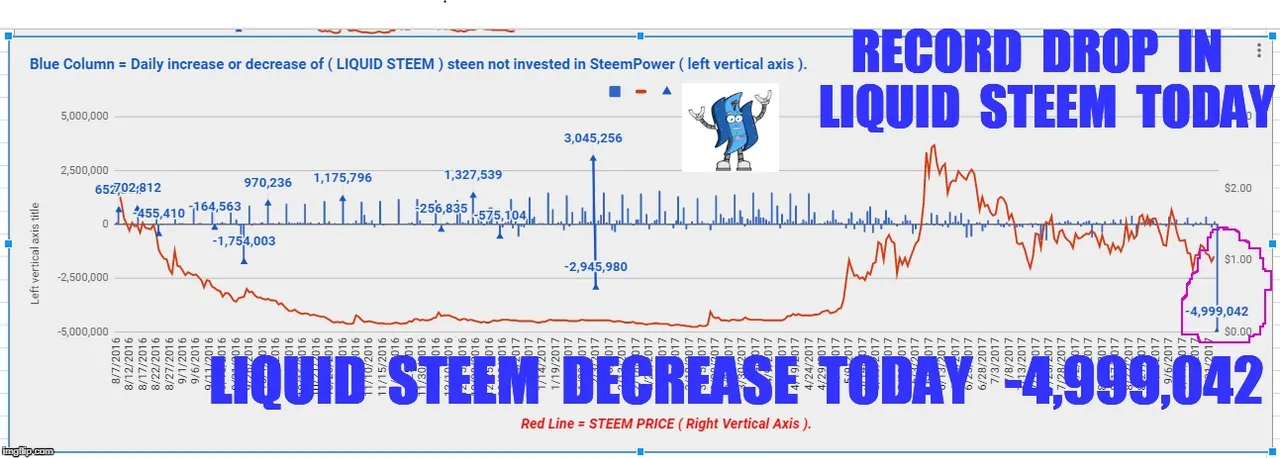
The blue columns in the chart represent the increase and decrease in Liquid Steem on a daily basis . On the chart below you can see we have never had a drop in Liquid Steem any where near this amount (-4,999,042) . This chart goes all the way back to August 2 , 2016 . The Red line is the Steem Price .
🐒
🐒 A record drop in Liquid Steem is a good thing it shows that a large amount of Steem has been powered up on that day and that means more confidence has been put into the Steemit Platform .
🐒
DISCLAIMER :
This content is for informational, educational and research purposes only.
Please get the advice of a competent financial advisor before investing your money in any financial instrument.
It is strongly recommended that you consult with a licensed financial professional before using any information provided here . Any market data or news commentary used here is for illustrative and informational purposes only.
Trading involves a high level of risk. Future results can be dramatically different from the opinions expressed herein. Past performance does not guarantee future performance. Consult an investment professional before investing.
All ideas , trade signals , opinions and/or forecasts are for informational, educational and research purposes only and should not be construed as a recommendation to invest, trade, and/or speculate . Any investments made in light of these ideas, trade signals, opinions, and/or forecasts, expressed or implied herein, are committed at your own risk. I am not an investment advisor, information shared here is for informational, educational and research purposes only and not a recommendation to buy or sell anything .