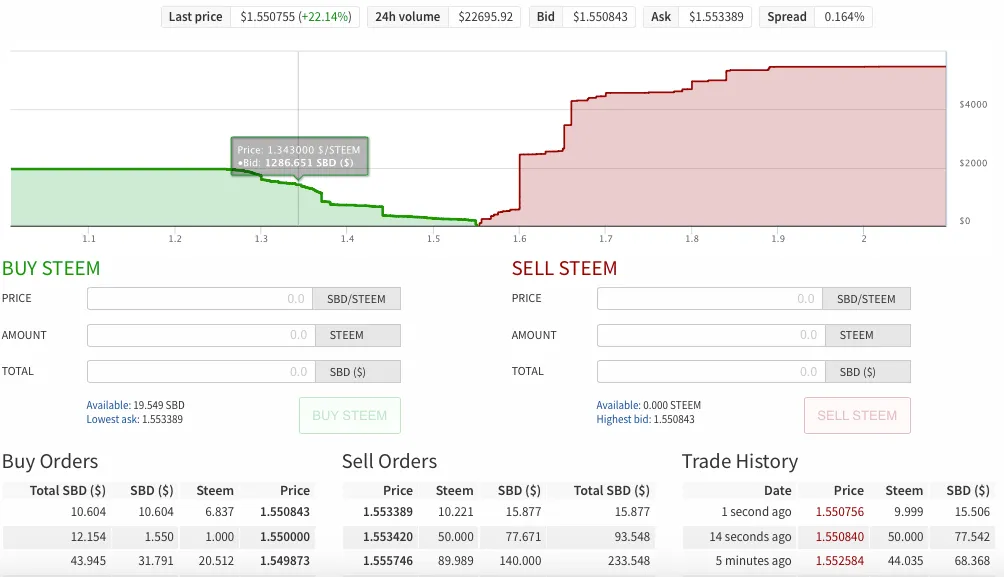
I'm currently having a good time trading SBD for STEEM and then Selling STEEM for SBD again just to do it all over but for a better trading experience, I would like to use some STEEM charts so I can see what are the levels of resistant and what are the levels of support.
The current Buy & Sell weight chart is just not cutting it out for me because it just doesn't show enough details. If you're going to have an internal market, why not have charts? I think that would be a good tool to add to the internal market for those of us that are into trading.
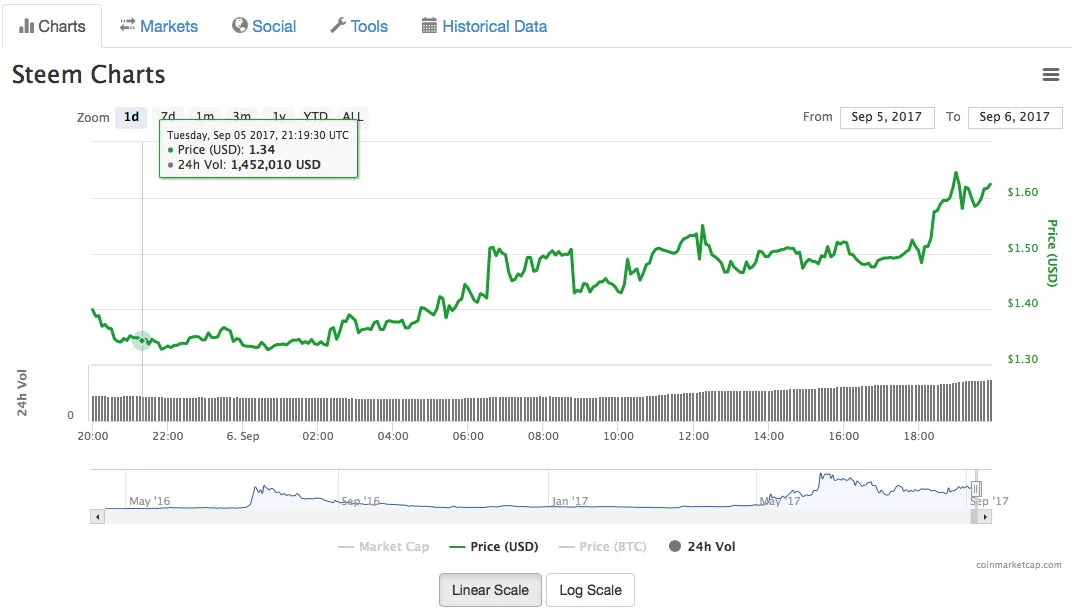
PLEASE STEEMIT DEVELOPERS, CAN YOU ADD THAT IN THERE PLEASE? Like a chart that shows the green and red candles, with all of the RSI and SMA lines and all of that good chart stuff. That would be amazing if you guys add charts to the Steemit Internal Market

