
After a period of three days, the crypto markets have resumed their downtrend. Total market capitalization of the crypto universe has dipped below $170 billion, which is a new yearly low.
Following the increase in volatility and the renewed downtrend, some analysts have projected abysmally low prices for Bitcoin. When the sentiment is negative, such forecasts can scare new investors away, and also force the weaker hands to dump their holdings.
In its short trading history, is this the first time that Bitcoin has fallen about 74 percent from its peak? No! According to Charlie Bilello, director of research at Pension Partners, the digital currency has twice plunged by 94 percent from its highs and again risen from the ashes. The third worst fall was 85 percent from its then highs. This shows that the asset class has experienced massive falls before. It is just that this time, Bitcoin is more in the limelight than on previous occasions.
During bear markets and periods of panic, the fundamentals take a back seat and the markets are driven only by sentiment. Though such periods offer an opportunity to load up for the long term, it is better to wait for the decline to end before buying because prices can go abysmally low during panic selling.
What are the lower levels that can attract buyers? Let’s find out.
BTC/USD
After a three-day break, the bears are back with a vengeance. Bitcoin has plummeted below the support of $5,450 with ease. Failure of the bulls to pullback to the $5,900 level shows selling pressure on every small rise.
BTC/USD
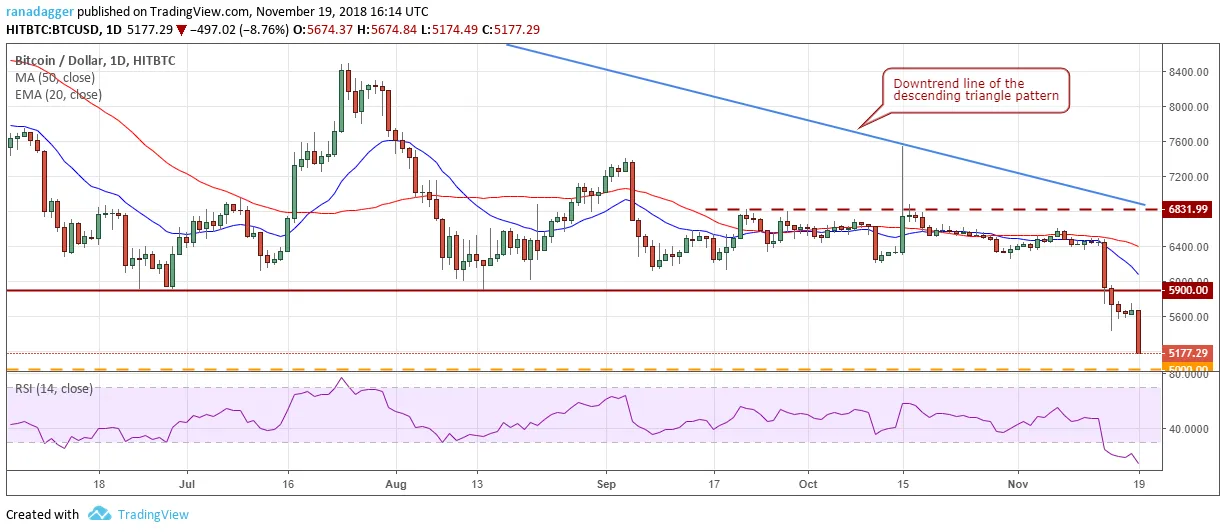
The 20-day EMA and the 50-day SMA have turned down and the RSI is deep in the oversold territory. This shows that the sellers continue to pound the BTC/USD pair without even waiting for a pullback.
If the bulls fail to provide support at the important psychological level of $5000, the fall can extend to $4700 and below that to $4100. However, the reading of about 15 on the RSI shows that the selling has been overdone and a pullback can happen anytime. The strength of the pullback will provide an insight on whether the decline has ended or if there is more to go.
When the price is correcting, it is difficult to predict where it will stop. Hence, we shall watch each support level closely. We will wait for the decline to end and a new buy setup to form before attempting a buy again. Until then, it is best to remain on the sidelines and avoid catching a falling knife.
XRP/USD
Ripple continues to be one of the stronger cryptocurrencies, as it is trading well above its recent lows.
XRP/USD
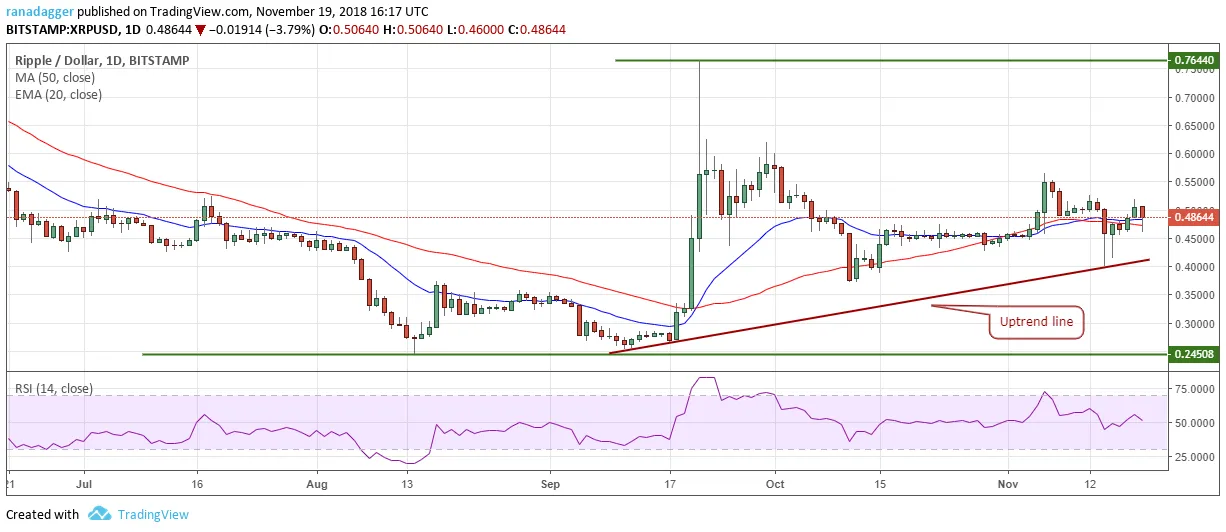
The moving averages are flat and the RSI is close to the midpoint. This points to a range bound action between $0.40–$0.565.
A breakdown of the uptrend line and $0.40 will be negative and can result in a fall to $0.37185 and below that to $0.26913. If the bulls breakout of $0.565, the XRP/USD pair can move up to $0.625 and above that to $0.76440. Traders should keep an eye on this, as it has been holding out well in this recent fall.
ETH/USD
Ethereum is taking it on the chin, seeing a new yearly low by breaking below the intraday low of $167.32 made on Sept. 12.
ETH/USD
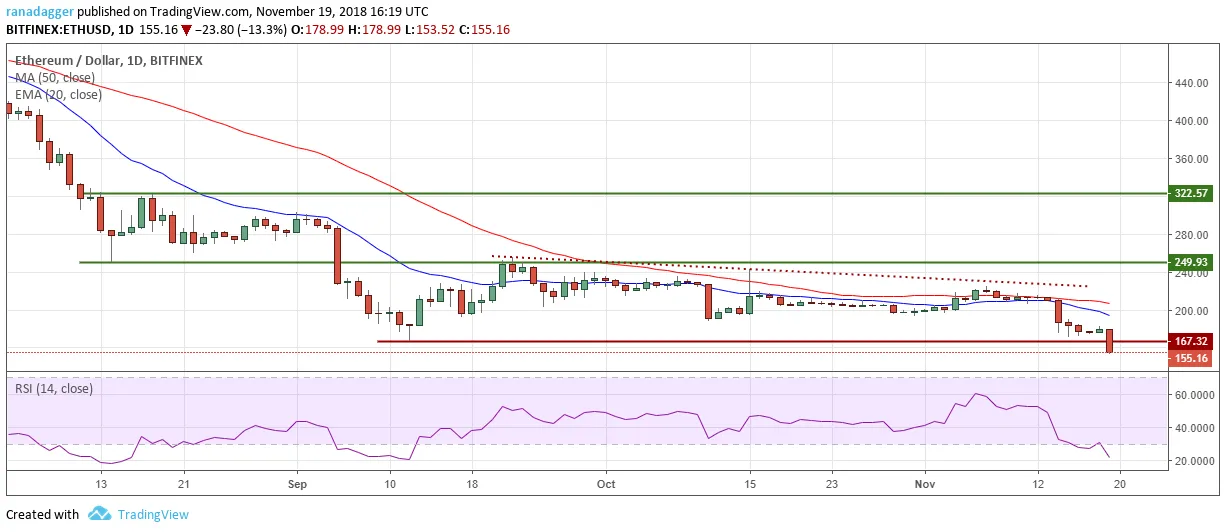
If the price closes (UTC time frame) below $167.32, it will resume the downtrend that can drag the ETH/USD pair to the next support of $136 and $110. The declining 20-day EMA and the RSI in the oversold territory show that the path of least resistance is to the downside.
However, if the bulls support the digital currency at the lower levels and push prices back above $167.32, it can rise to the 20-day EMA. We shall wait for a trend reversal to be signaled before proposing a trade.
XLM/USD
Stellar has broken down of the ascending channel. If the price closes (UTC time frame) below the support line, the drop can extend to $0.21494424 and below that to $0.20400799.
XLM/USD
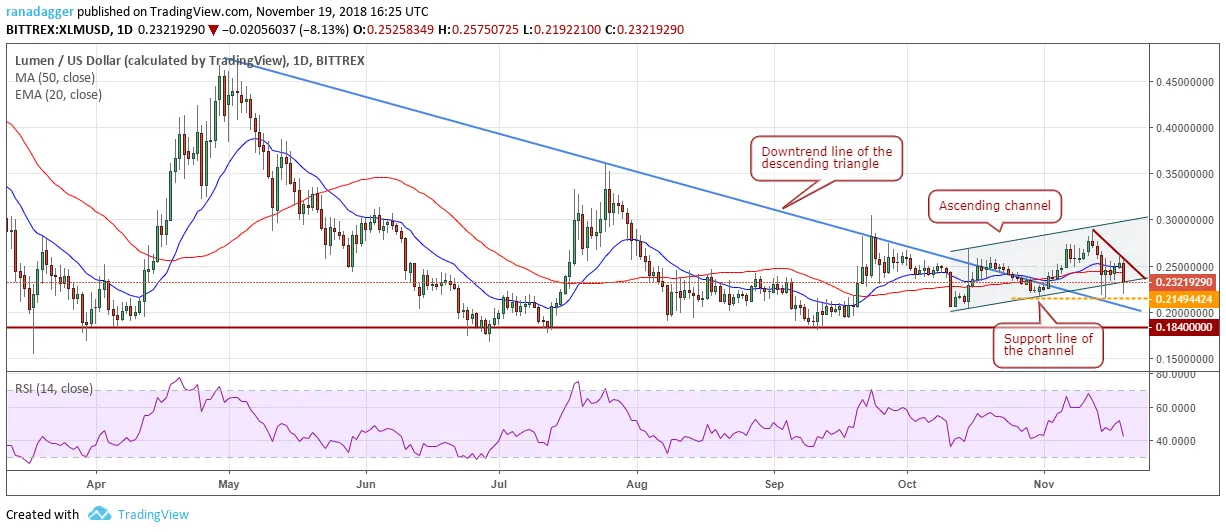
Failure of the bulls to capitalize on the breakout of the descending triangle pattern is a bearish sign. The XLM/USD pair will resume its downtrend if the bears sink it below the critical support at $0.184. The flat moving averages and the RSI just above the 41 levels point to a possible range formation. While the upper end of the range is at $0.30, the bottom of the range is yet to be established. A breakout above $0.305 is likely to signal a trend reversal.
EOS/USD
After struggling to stay above $4.493, EOS plunged below the support and also broke below the next level of $4.1778. The final support is at $3.8723, below which the digital currency will form a new year-to-date low.
EOS/USD
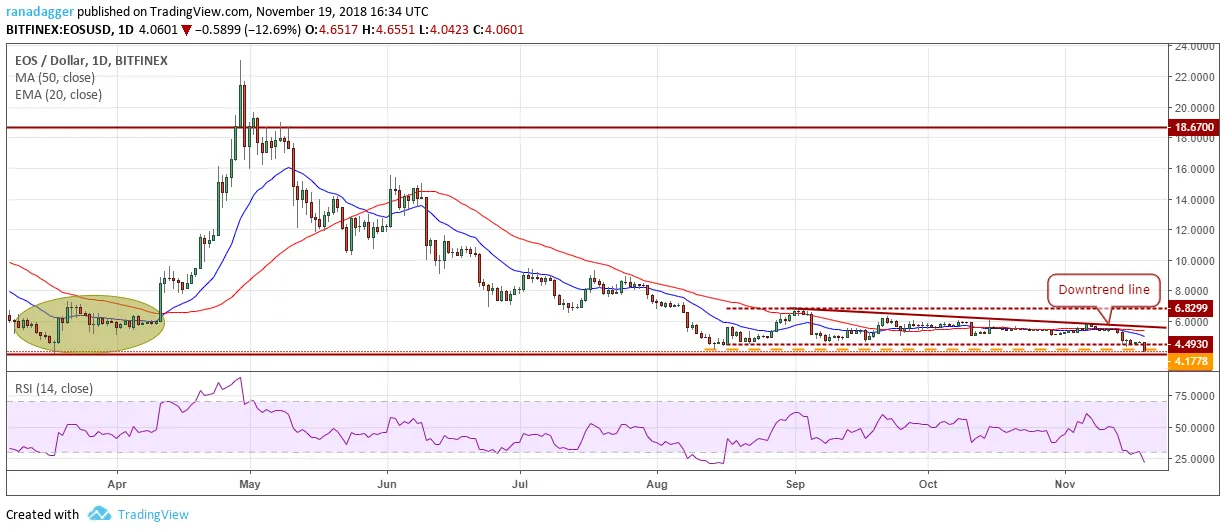
The 20-day EMA is sloping down and the RSI is in the oversold territory, which shows that the balance is tilted in favor of sellers. Below $3.8723, the next support is at $3. The EOS/USD pair will show its first signs of strength if it breaks out of the moving averages and the downtrend line. We suggest traders wait for the decline to end and a new buy setup to form before initiating any new long positions.
LTC/USD
Litecoin seems to be falling into a bottomless pit as it continues to make new lows. With today’s fall, it has broken down of the support at $40.
LTC/USD
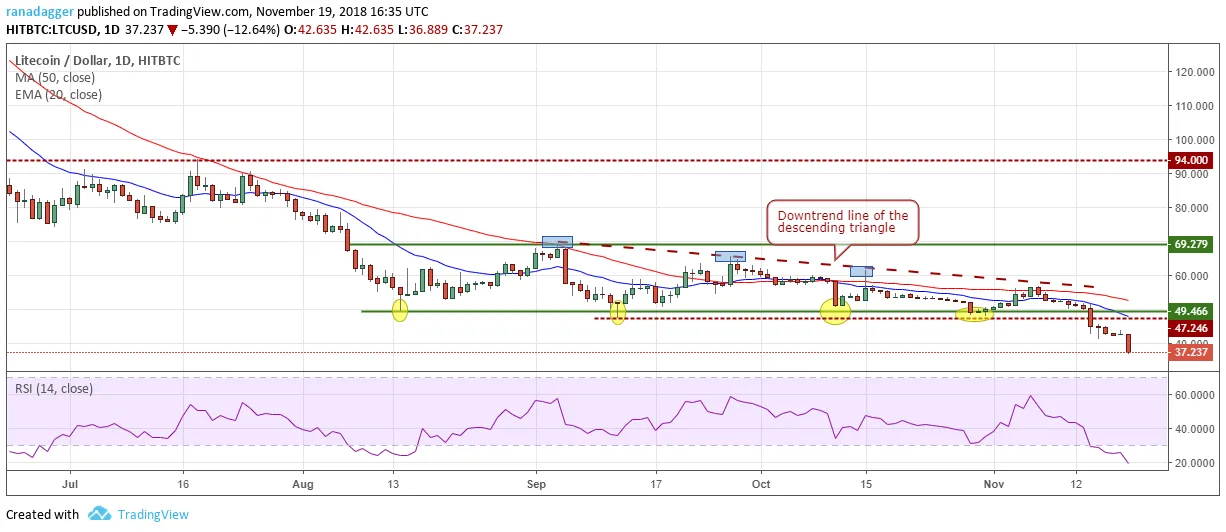
Both the moving averages are trending down and the RSI is in the oversold territory, which shows that the bears are in command. Its next support is at $32. We anticipate an attempt to bounce off the support at $30–$32. With the recent fall, the technicals of the LTC/USD pair have been damaged. It will have to enter into a period of consolidation before a new uptrend can start.
ADA/USD
After holding $0.060105 for the past five days, Cardano broke down of the support, making new lows. Its next support is $0.043722.
ADA/USD
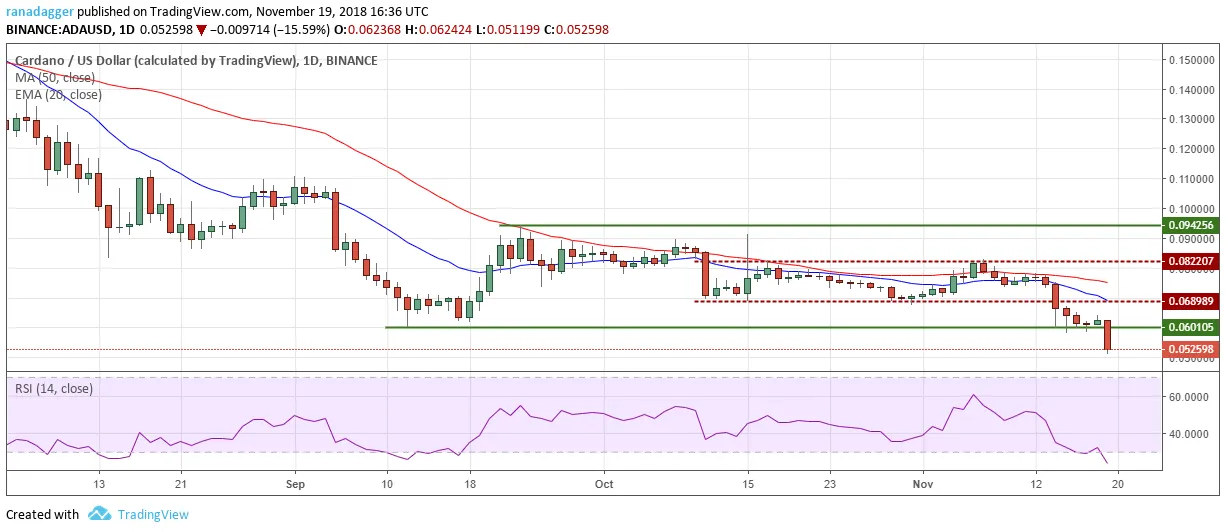
The RSI has entered deep into the oversold territory, which has previously resulted in a pullback. However, the ADA/USD pair will continue to face selling on every recovery. Traders should wait for the decline to end and buyers to return before attempting to buy it.
XMR/USD
The bounce from $81 levels on Nov. 15 was short lived as it did not find follow up buying. Today, Monero nosedived below the support at $81. If the bears succeed in closing (UTC time frame) the price below the support, it will be the lowest in more than a year.
XMR/USD
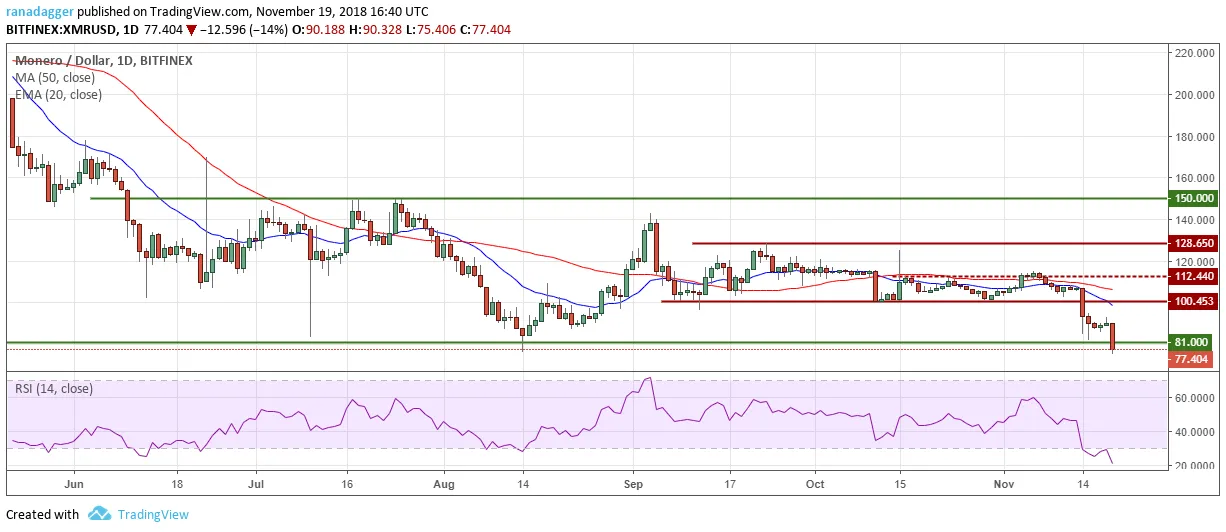
The breakdown can result in a fall to the next support at $61.50. We anticipate a strong support close to the $60–$61.5 level. However, with both moving averages sloping down and the RSI in oversold territory, every pullback will be met with strong selling. The XMR/USD pair will have to spend a long time in forming a bottom before a trend reversal is signaled.
TRX/USD
TRON has broken down of the range it had been trading in since Aug. 8, which is a negative sign. It has resumed its downtrend that can push prices to the next support at $0.00844479 if the support at $0.01587681 breaks down.
TRX/USD
The RSI is deep in the oversold territory, which can result in a pullback. But with the 20-day EMA sloping down, the TRX/USD pair will face stiff resistance at $0.0183 and above at the moving averages. Our bearish view will be negated if the bulls quickly reverse prices within the next couple of days and sustain above $0.0183.
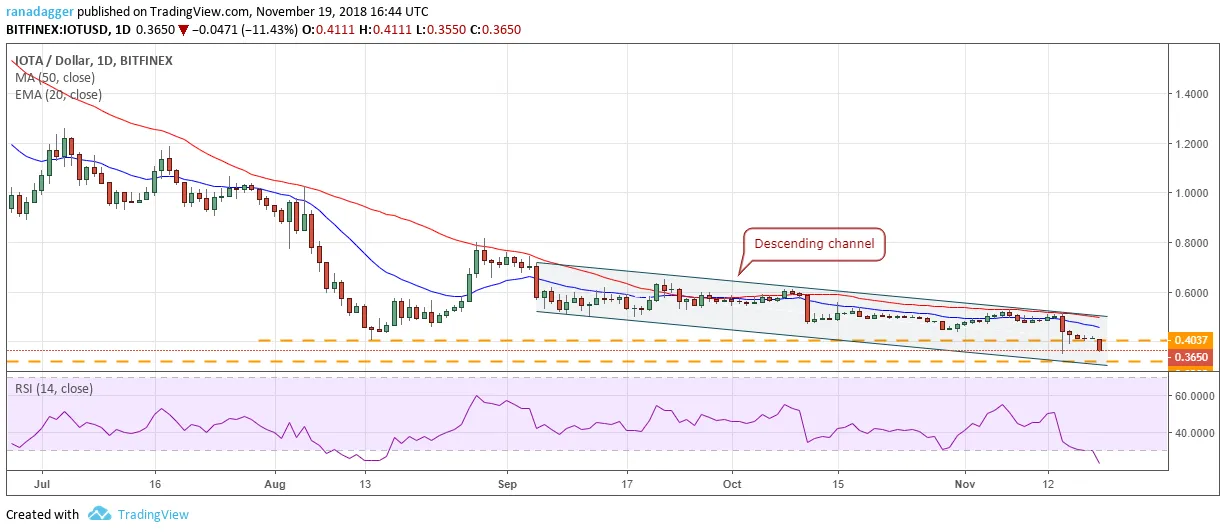
IOTA/USD
IOTA is currently trading inside a descending channel. It has again dropped to close to $0.3501 from which it had bounced on Nov. 14.
IOTA/USD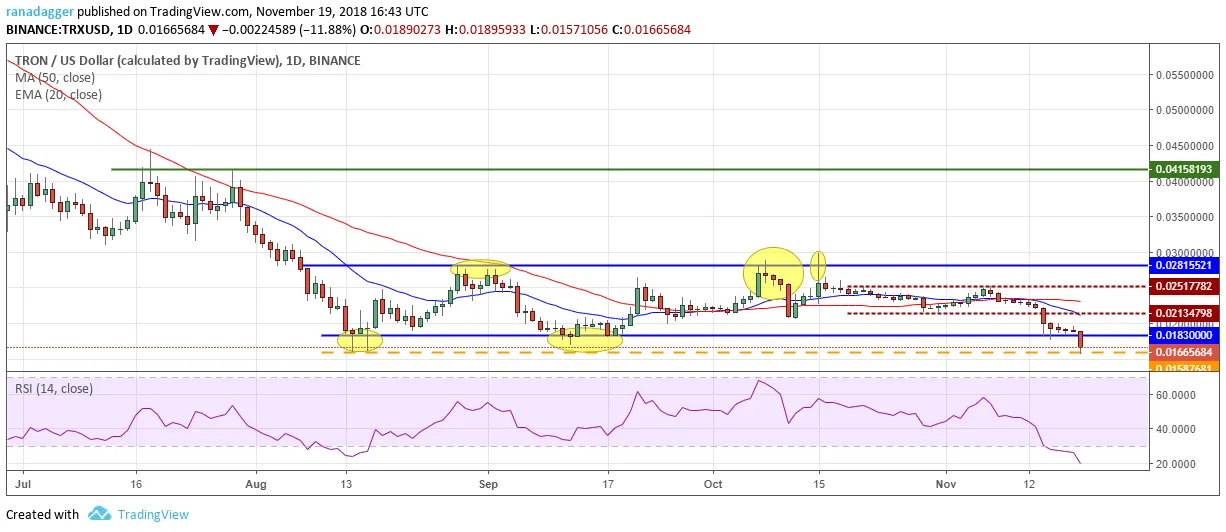
If the bulls succeed in achieving a bounce once again, the IOT/USD pair might rise above $0.4037. On the other hand, if the bears sink prices below the $0.3501 level, the slide can extend to the next support at $0.32 and below that to $0.23.