
I previously wrote in detail about the bandwidth limitation that was affecting all the Steem users, specially the minnows.
https://steemit.com/witness-category/@drakos/the-bandwidth-limitation-problems-and-solutions
My interest on that matter started around the end of January 2018 where the problem was hitting us the hardest on a daily basis, and the https://steem.chat/help channel was being flooded with frustrated users (notice it's steem.chat now, instead of steemit.chat). Therefore I researched and dug deeper to understand what was happening. The main parameter governing the bandwidth allocation was the reserve ratio, as I covered in my previous post.
Charting the Reserve Ratio and Average Block Size
So I figured I'd collect some data to analyse the movements of the reserve ratio as well the average block size, to see if there was any tangible correlation to help us understand the issue. After days of developing the chart and testing, I started collecting data since 1 February 2018 with 5 minutes intervals. The data is stored in a MySQL database and the chart is powered by Google charts.
The chart is available at https://steemian.info/reserveratio or by clicking the Tools in the navigation bar on the website.

After days and weeks of collecting points, a pattern started to emerge. Although I was expecting to see a direct correlation between the reserve ratio and the average block size, I didn't find any! In fact, while the reserve ratio would fluctuate drastically during the day, from <100 to 20000, the average block size remained relatively around the 16384 bytes threshold (25% of the maximum block size). The average block size sometimes spiked to 19000-20000 but never above that, and it dipped to 12000 and even 5000 at one time! But overall, it stayed around 16000 bytes.
Surely there are mathematical factors (beyond my abilities) behind the algorithm that controls the reserve ratio. Nevertheless the chart showed a daily pattern of rush hours. Every day, roughly between 8:00 and 14:00 EST, the reserve ratio dips below 100, that's where the users experience the worst effects of the bandwidth limitation. The system recovers quickly past 15:00 to go back to more acceptable levels above 1000-2000 and reach its peak at 20000 during the night. And... the cycle starts again on the next day.
Here's the chart for 9 March 2018. It was an exceptional day where the reserve ratio barely dipped below 2000! Smooth sailing for all. As expected, the reserve ratio was cruising at 20000 after 15:00, like all previous days.
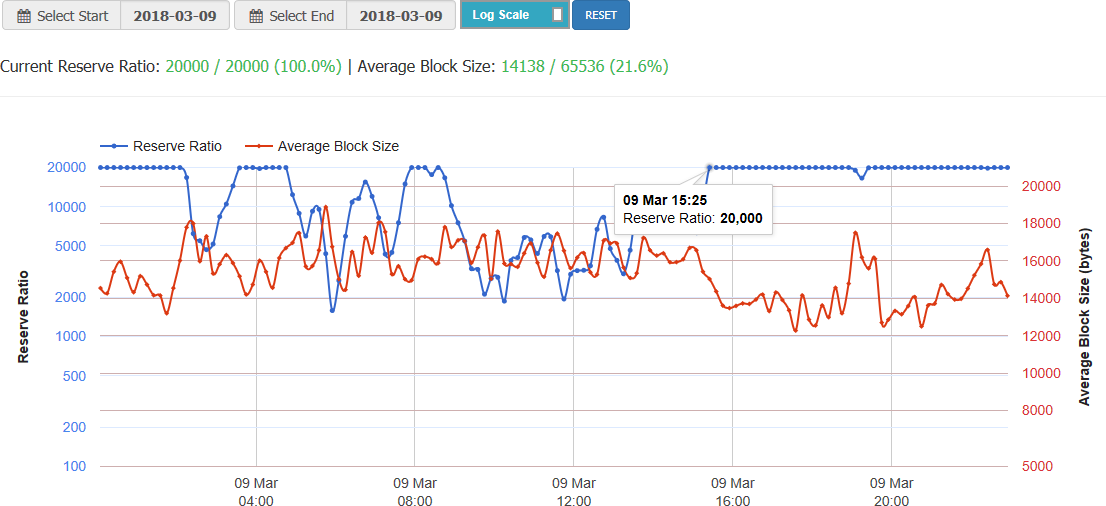
(click to enlarge)
And here's the chart for 1-9 March 2018, where we had many days below 100.
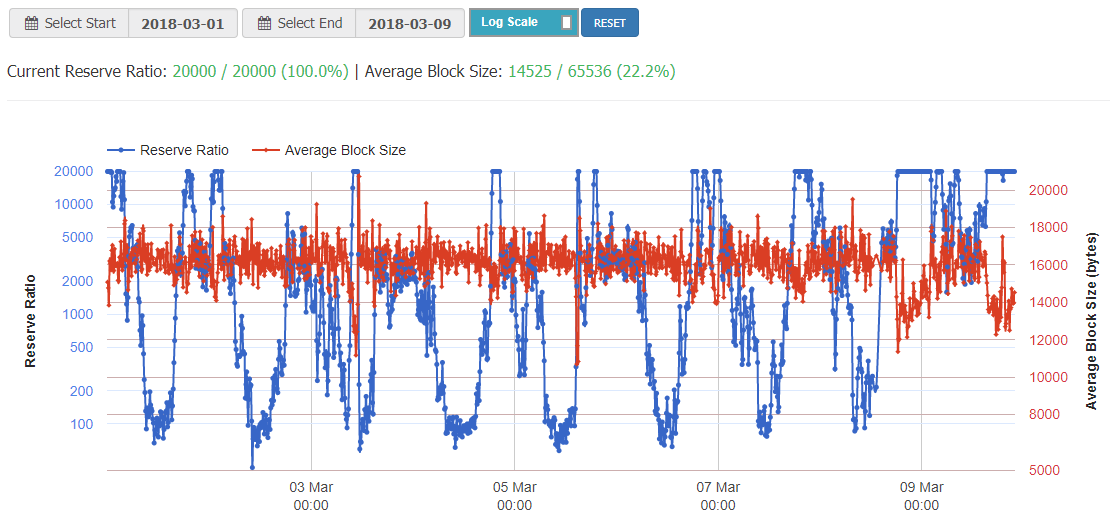
(click to enlarge)
According to @roadscape, who's been following this issue very closely for a while now, when the reserve ratio goes below 500 is when we start to see problems. In my observations, when we're below 100 is when the users start to complain.
Interactive Live Chart
The chart is live and interactive with many features to play with. Although I'm collecting data every 5 minutes, I'm showing the points every 10 minutes, otherwise charting weeks of collected points would be too sluggish. The chart will refresh every 5 minutes if you leave it open. By default, the current day is showed but you can customize the chart as follows:
- Click on the dates to select a Start and End period.
- Toggle the Linear (default) or Log Scale. I recommend the logarithmic scale where it's easier to see and analyse the lower reserve ratio values.
- Zoom in/out with the mouse wheel.
- Hover the mouse on the points to show their values.
- Left-click and hold to move horizontally.
- Right-click on the chart to reset.
What Have We Learned?
If you're having daily problems with bandwidth limitations, I proposed several solutions in my previous post. For the users, it's either reduce the weekly transactions and/or power up more STEEM. Now, we have learned there's a third option and it consists of avoiding the rush hours between 8:00-14:00 EST.
Perhaps it's an opportunity to do some real work during the day, and blog on Steemit in the evening. I know it's hard to resist the temptation of Steemit...

Closing Thoughts
I hope you find the chart useful, whether you're a user or a Steem developer. If you have suggestions or any other data/charts you might want, let me know, I'd be happy to oblige.
Thanks to @roadscape for his input about the reserve ratio during my initial research.

Available & Reliable. I am your Witness. I want to represent You.
🗳 If you like what I do, consider voting for me 🗳

If you never voted before, I wrote a detailed guide about Voting for Witnesses.
Go to https://steemit.com/~witnesses. My name is listed in the Top 50. Click  once.
once.
Alternatively you can vote via SteemConnect
https://v2.steemconnect.com/sign/account-witness-vote?witness=drakos&approve=1