
This is probably the final one of a short series of posts which attempt to document the Sincerity Lab functionality. It will make more sense if you read part 1 and part 2 first.
To get started in using the tool visit https://steem-sincerity.dapptools.info/lab, and click 'Existing User Log In'. Use demo/demo as the account name and password.
In the last post, I briefly described how you can use Steem Sincerity Lab to examine your followers and the people you follow, but thought I should cover this aspect in more detail.
Please remember that this Sincerity data only covers 'active accounts' which have commented or voted in the last 14 days. This probably gives a better reflection of your number of real followers, but will be lower than the number shown on Steemit.com.
When making a scatter plot, you can select the two data fields you want to use for the X and Y axes using the dropdowns (see part 2 for more info about what the fields represent).
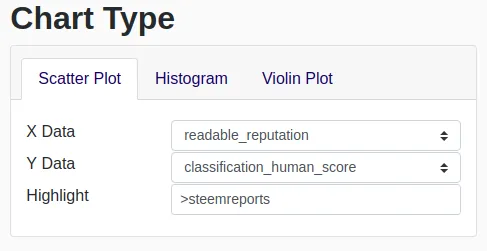
You can use the 'Highlight' field in any of the following ways:
Highlight: andybets
Adds one red highlighted point showing where (in the data) the account is.
Highlight: andybets, steemreports, ionlysaymeep
Adds three red highlighted points showing where (in the data) each of the listed accounts are.
Highlight: >andybets
Read as 'following andybets'. This adds highlighted points showing each of the accounts following andybets.
Highlight: andybets>
Read as 'andybets is following'. Adds highlighted points showing each of the accounts andybets is following.
Highlight: |andybets
Read as 'blocking andybets'. Adds highlighted points showing each of the accounts ignoring/muting andybets.
Highlight: andybets|
Read as 'andybets is blocking'. Adds highlighted points showing each of the accounts andybets is ignoring/muting.
To show only the accounts you selected, without other Steem accounts for comparison, move the 'Sample Size' slider down to 0 before creating the report.
As with all the data that can be presented as a chart in Steem sincerity, the first 25 rows of this data can also be seen in the table below the chart, with clickable links. The whole dataset can be downloaded using the link at the bottom of the page, for further analysis in a Spreadsheet.
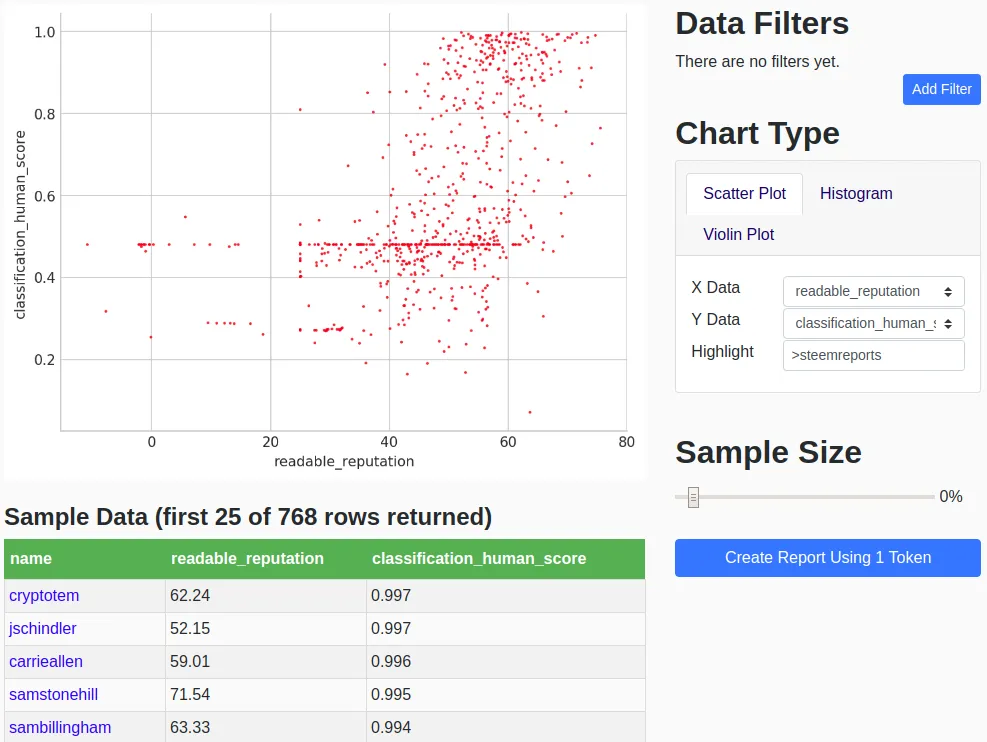
The table sorting is based on the 'Y Data' and is in descending order.
Please let me know if you have any questions or suggestions about this tool.