I've been posting mostly on STEEMBTC, and perhaps some of you may be interested in STEEMUSD as well. As you probably have seen on the Internet, STEEMUSD has also been on a decline. It is currently at $2.52, down sharply when we started the week. Let's have a look at the daily chart:
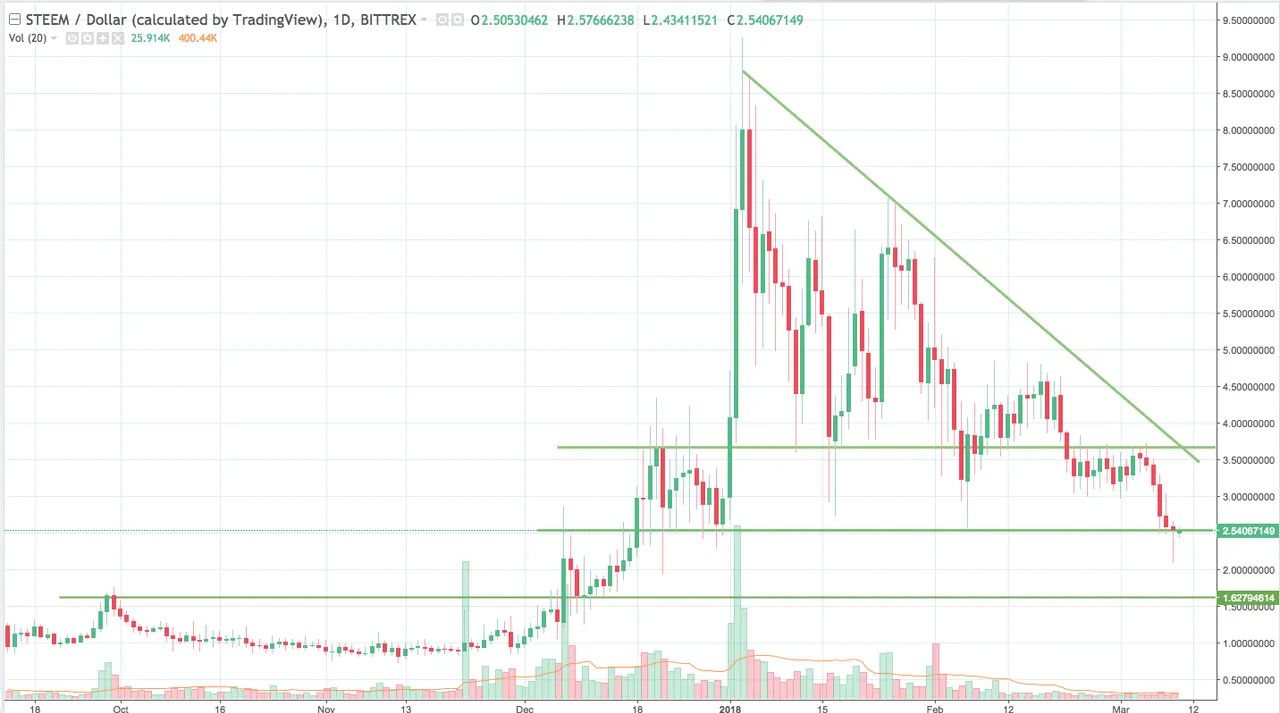
Chart courtesy of TradingView
The chart shows a similar pattern as STEEMBTC, with a few notables:
- The decline in STEEMUSD seems to be a bit more pronounced compared to STEEMBTC. This indicates that as BTC price fell, STEEM followed suit. However, STEEM experienced a steeper decline during the period.
- We are sitting right along a support line at $2.50. Price attempted to fall below this level, but bulls were able to successfully defend this level.
- The doji candle yesterday may provide a temporary respite to the decline although similar to my narrative on STEEMBTC, this doesn't indicate a shift in long term trend yet. There is a downtrend line drawn on the chart which needs to be surpassed first before any real shift in trend can be considered.
- Below this level, the next support line is $2.00 and below that $1.60. On the other hand, resistance is seen at around $3.50 - $3.60.
Personally, I don't expect big moves over the weekend, so we may trend sideways in the next two days. It will be interesting to see how price action goes next week.
Have a good weekend everyone. As always, trade carefully!
Risk Warning: All comments, charts and analysis on this post are purely my own and should in no way be treated as recommendations or advice, nor should they be construed as an endorsement or recommendation to buy, sell or hold. Please do not trade based solely on the information provided on this post. Furthermore, past performance does not guarantee future success. Always do your own due diligence and analysis when trading.