Selam arkadaşlar;
Burada yer alan yatırım bilgi, yorum ve değerlendirmeler Yatırım Danışmanlığı Kapsamında DEĞİLDİR. Yapmış olduğum analiz ve değerlendirmeler teknik verilere dayalı eğitim çalışmasıdır.
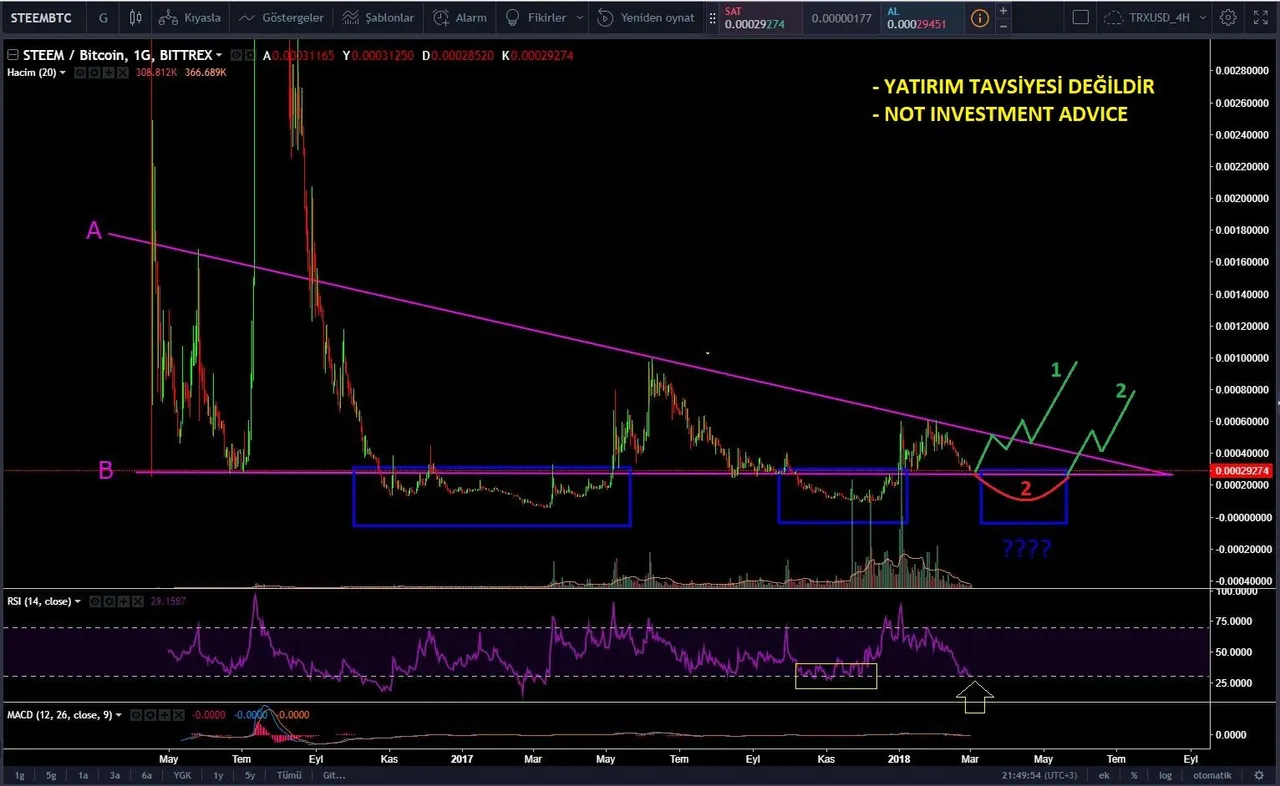
- Steem/BTC günlük grafiğinde A düşen trendini ve B desteğini takip ediyorum. (A trendinin üzerindeki kısmı ihmal ediyorum.
- B trendinin destek olarak iyi olduğunu düşünüyorum. Ancak grafikteki mavi kutulara dikkat edecek olursak 2 defa trendin altına sarkma oluşmuş. Hali hazırda da B trendi üzerinde olduğundan grafiğe boş bir kutucuk eklemek istedim. Öncekilere benzer hareket yapacağının garantisi yok ama piyasa koşullarına göre ithimal dahilinde.
- Yukarı yönlü hareketin ivme kazanması için A trendinin güçlü bir şekilde kırılması gerektiğini düşünüyorum. B trendi aşağı kırılır ise de önceki hareketlere benzer bir durum söz konusu olabilir.
- Grafikte belirtmiş olduğum yeşil ve kırmızı çizgiler fiyat hareketinin izleyeceği muhtemel yolları göstermektedir (Tamamen şahsi görüşümdür. Gerçekleşmesi kesin değildir.).
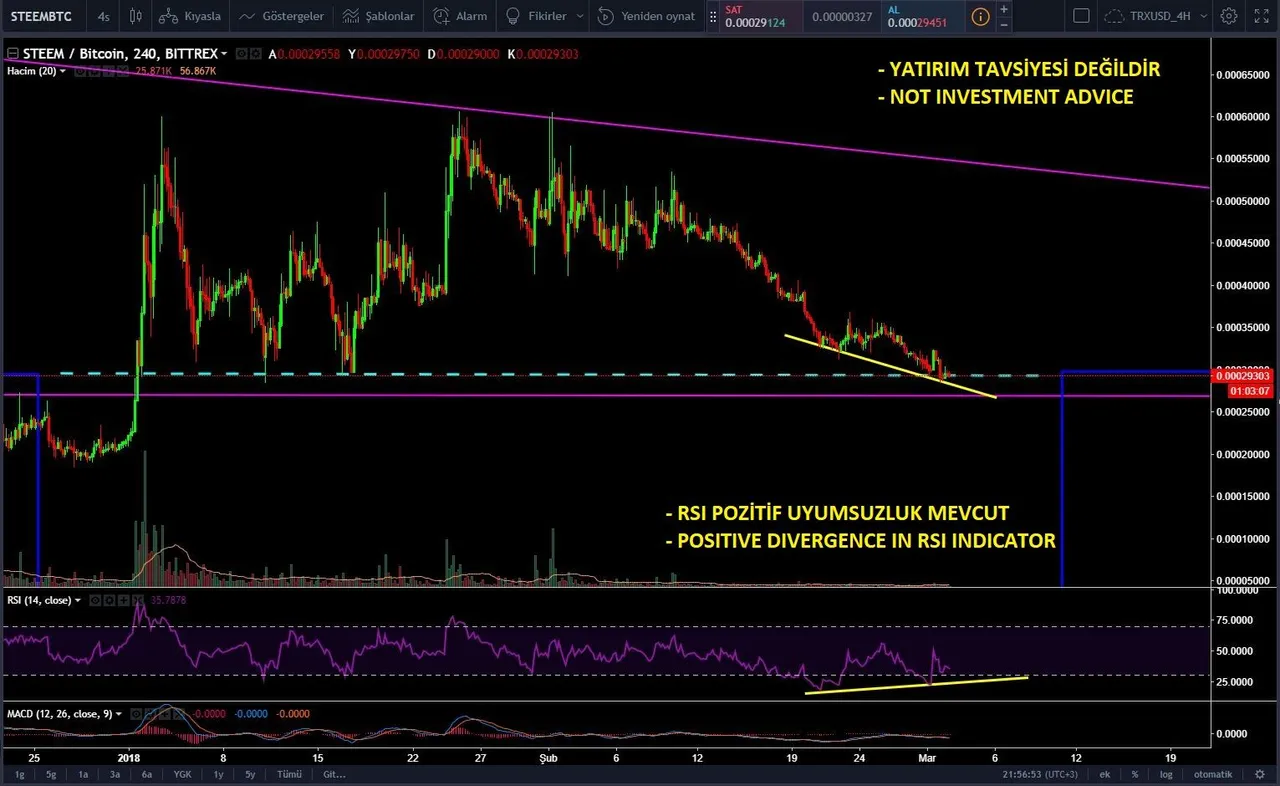
- 4 saatlik grafikte ise RSI indikatörü ve fiyat arasında positif uyumsuzluk olduğu görülmektedir. Positif uyumsuzluk yükselişi destekler nitelikte yorumlanır.
Teknik analiz ile ilgili sorularınızı ve eleştirilerinizi yorum olarak yazmanız beni mutlu edecektir.
English
Hello Friends;
The investment information, comments and evaluations contained herein are NOT IN Investment Advisory. The analyzes and evaluations I have made are based on technical data.
- I think that A trend must break strongly in order for the upward movement to gain momentum. While the B trend is broken down, it may be a situation similar to previous movements.
- I follow Trendin and B support falling on Steem / BTC daily chart. (I neglect the part above the A trend.)
- I think that B trend is good as support. But if we pay attention to the blue boxes on the chart, two times the trend has been sagging underneath. We are currently on the B trend so I wanted to add a blank box to the chart. There is no guarantee that you will act similar to the predecessors, but according to market conditions it is within the limit.
- The green and red lines that I have indicated on the graph indicate the possible ways in which the price movement will follow (It is completely personal, it is not certain that it will happen).
- On the 4-hour chart it appears that there is a positive divergence between the RSI indicator and the price. Positive divergence is interpreted as support for ascension.
I would be happy if you write down your comments about technical analysis.