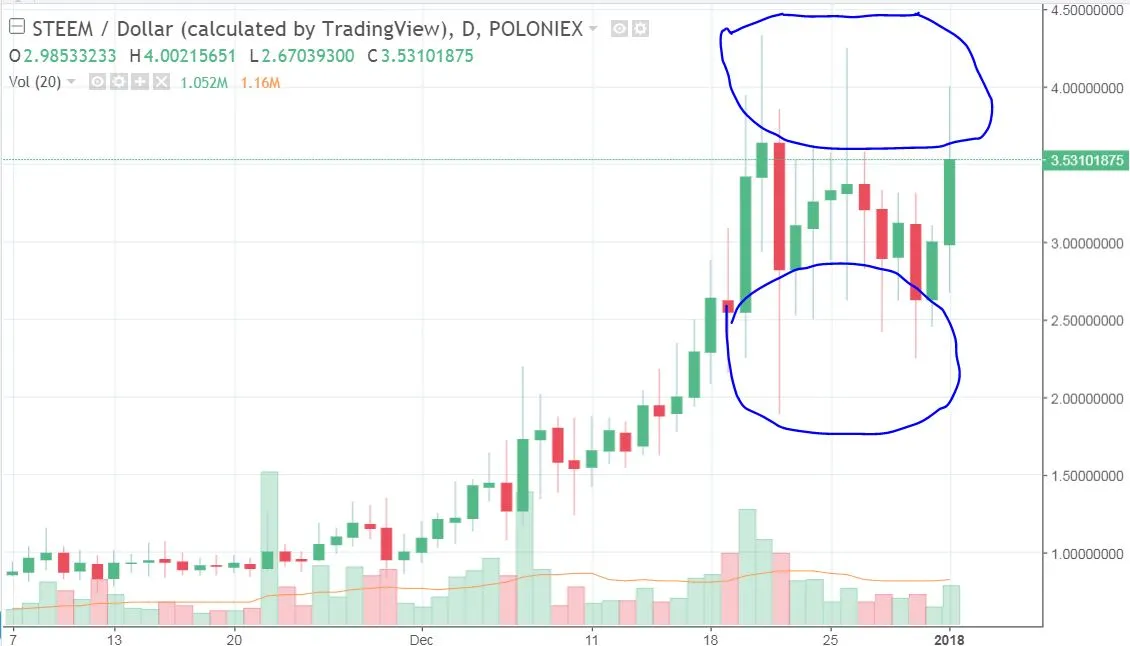
No doubt we have a bullish market in terms of Steem it started the journey on 1st december from 0.98 and grown almost 350% in a period of 20 days, but the above shown picture is the daily chart of STM/USD, it can clearly be seen that the market is range bound and we already have 2 long wick candles on daily chart and the currenct one may going to be the third one as the market is going to test our trendline currently. let me show the picture closely.
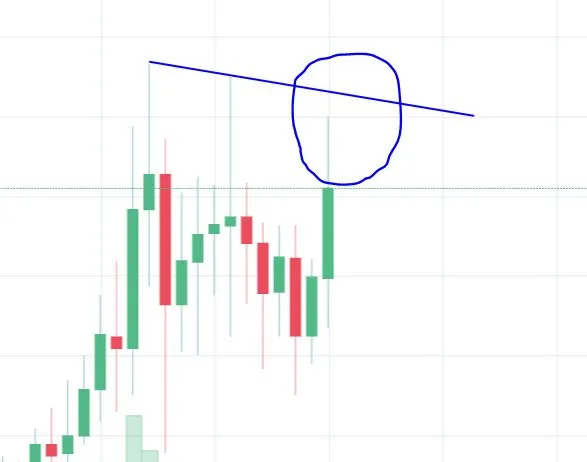
So the scenario is in order to have a bullish wave we need this current daily candle to break and close above this trendline.
CMP: 3.5
Support: 2.66 , 2.24 , 1.88
Resistance: 3.6 (currently testing), 4 , 4.32
Steem has something amazing cooking on long terms charts and i will soon share my long terms analysis on Steem.
Please Upvote and Resteem, Thankyou