I wanted to see how the transaction activity for Steemit has been going, and how Bitcoin compares both now and when it started. Maybe there is some information to gleam from a comparative analysis. So I did that and decided to post about it.
I ask you to offer your insights from the charts, but no one really knows how things will go. This is just a creative exercise to see what we can envision as possibly coming ahead, from the current and previous activity.
Steem
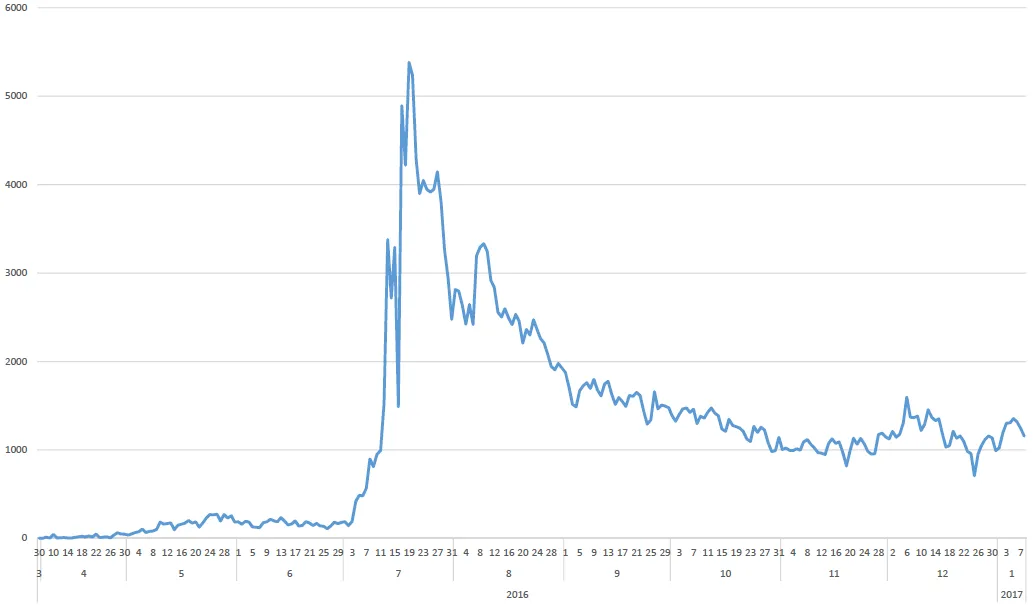
This is Steem's transaction activity level each day since it was online:
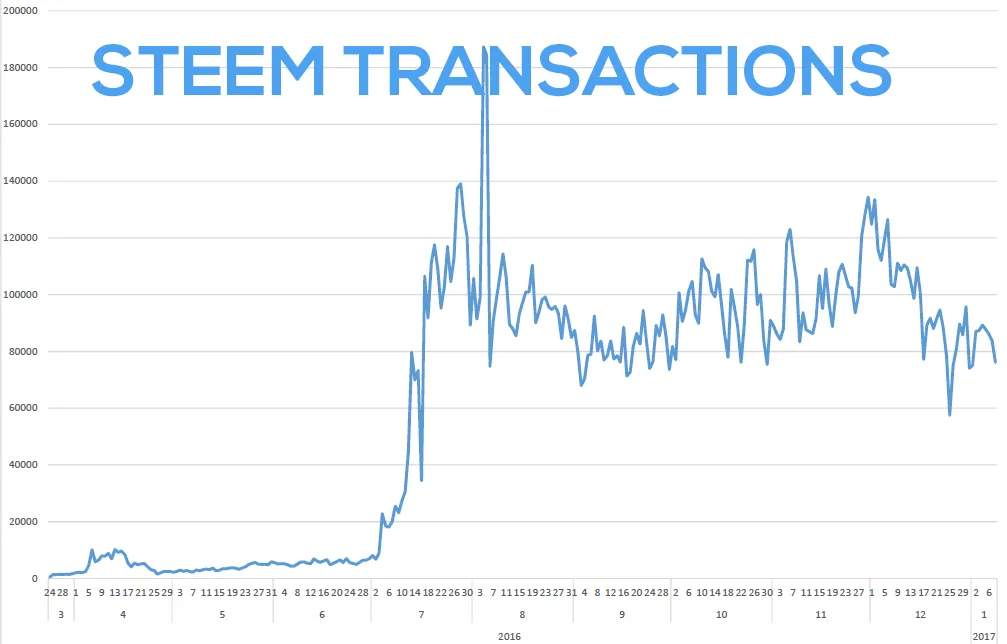
The above includes all transactions, including posts and comments, everything.
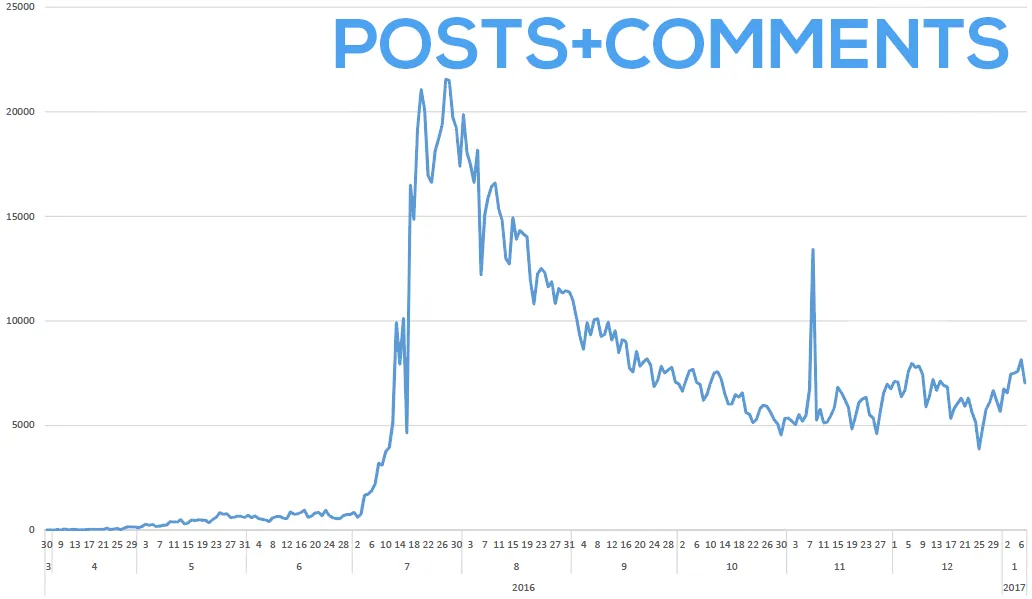
This is Steem's post and comment activity level each day since it was online:
I haven't yet figured out how to do a subtraction chart, but if you subtract the posts and comments from the total transactions then you get a better idea of the non-posting transactions that are being made, such as those related to the token itself.
This is what it looks like with an approximate adjustment on my part (not exact):
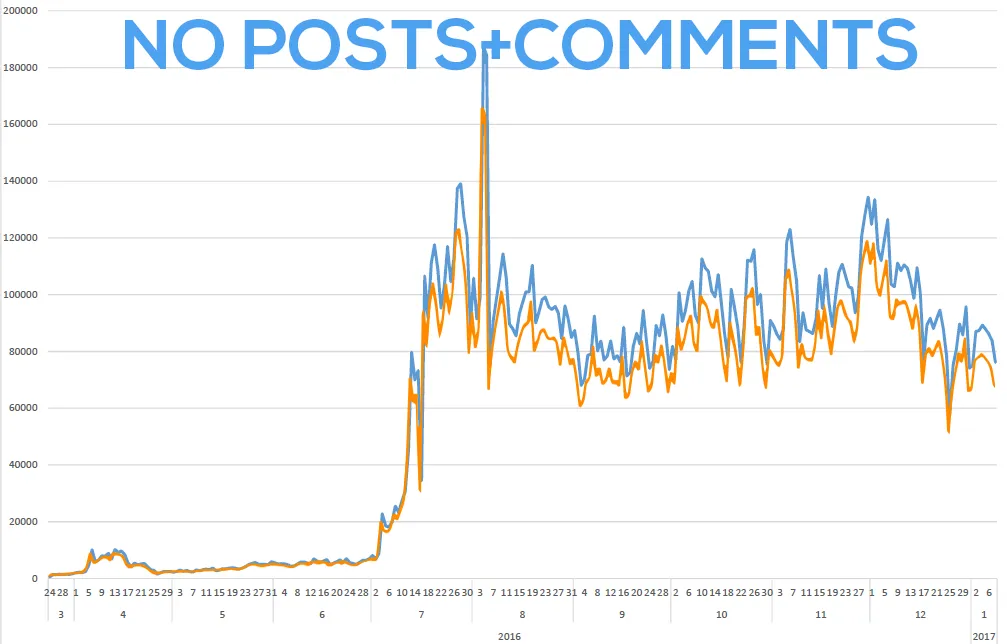
So that is the non-post transactions, that include all the token transactions involved, just not the posts themselves. This represents a more or less (I think, correct me please) the financial activity on the blockchain.
This prepares the data for a slightly more accurate comparison with Bitcoin.
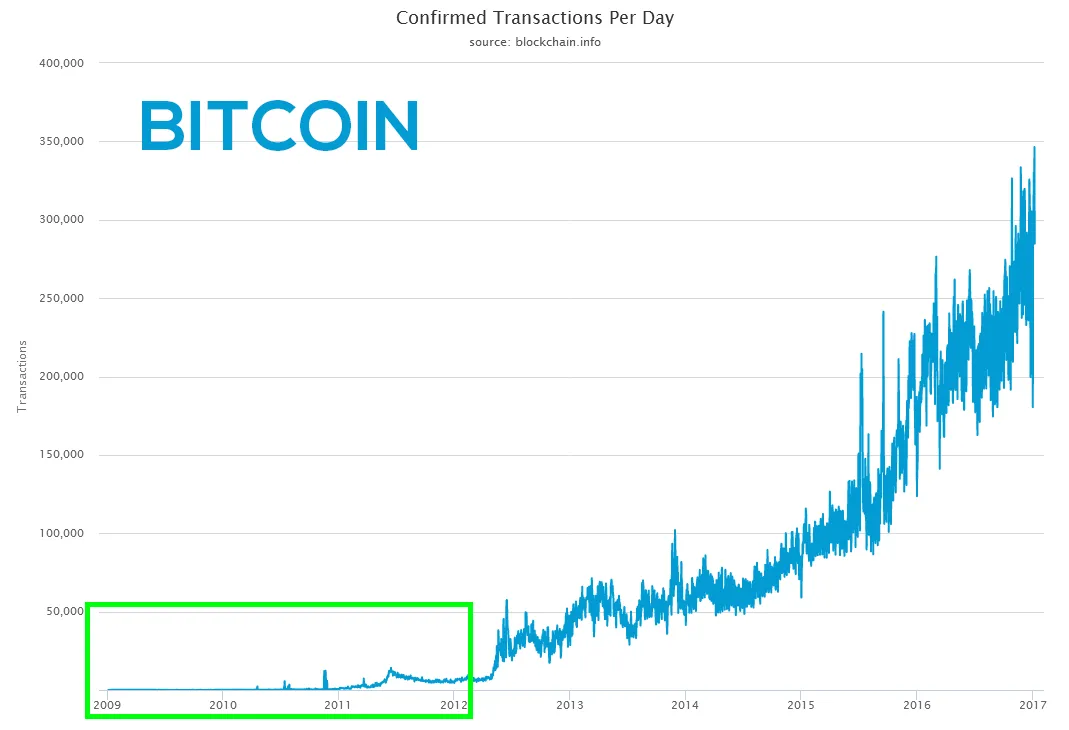
Bitcoin
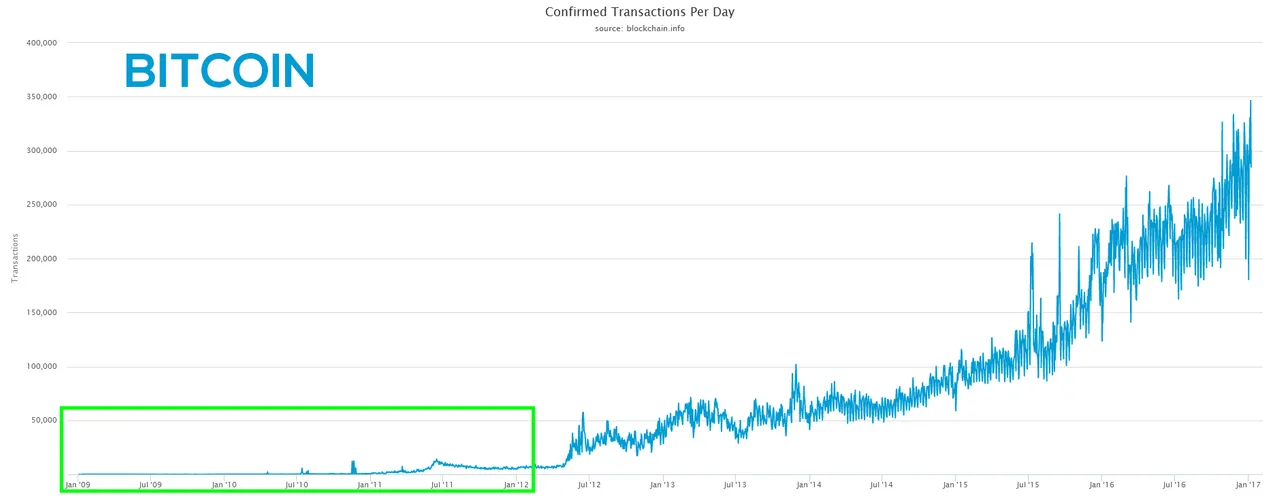
Here is the Bitcoin transaction activity (Confirmed Transactions Per Day) since 2009, with a 3 year section in a green box for relative comparison to Steem.
This is the same graph, but smaller, just to show you how it changes:
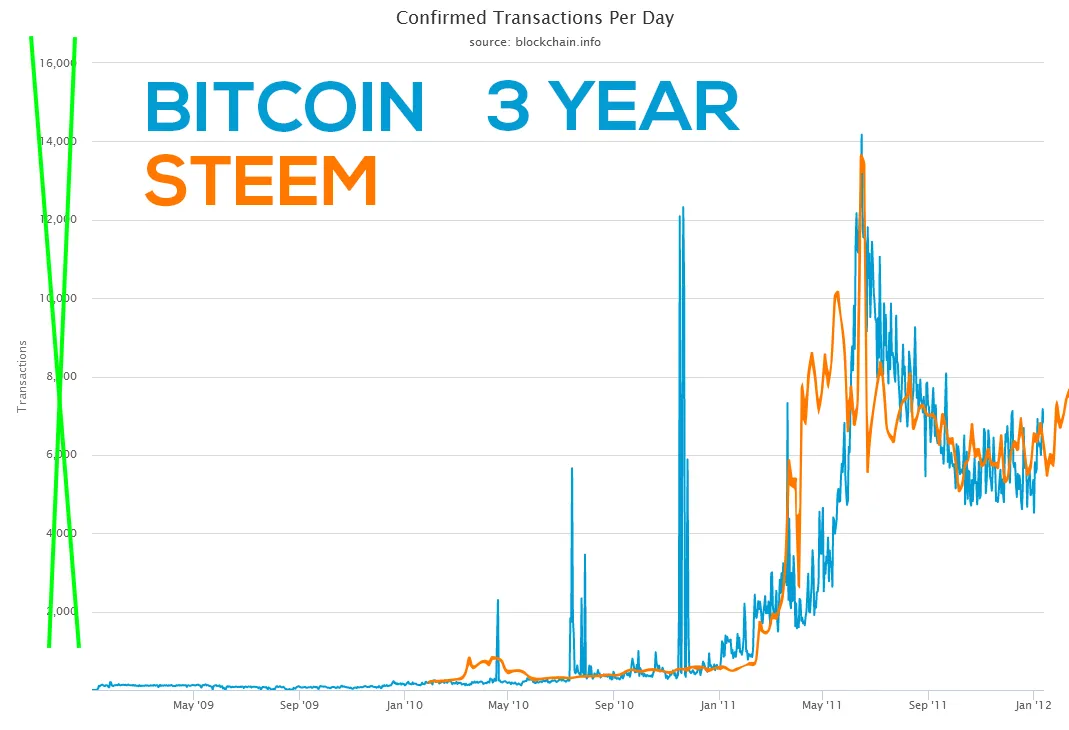
And now the Bitcoin transaction level for the first 3 year approximately.

I took that activity first because it was relative to the start of Bitcoin, and we are at the start of Steem.
This is what Steem looks like in terms of the first major bump in Bitcoin activity.
But, there is also the transaction volume to account for. That means another relative comparison needs to be done in terms of transactions scale.
So that's what I did next, to try to match Steem's transaction levels to Bitcoin's transaction levels.
Here is an overlay of Steem so far, at the transaction high matched to the same and current Bitcoin transaction activity level:
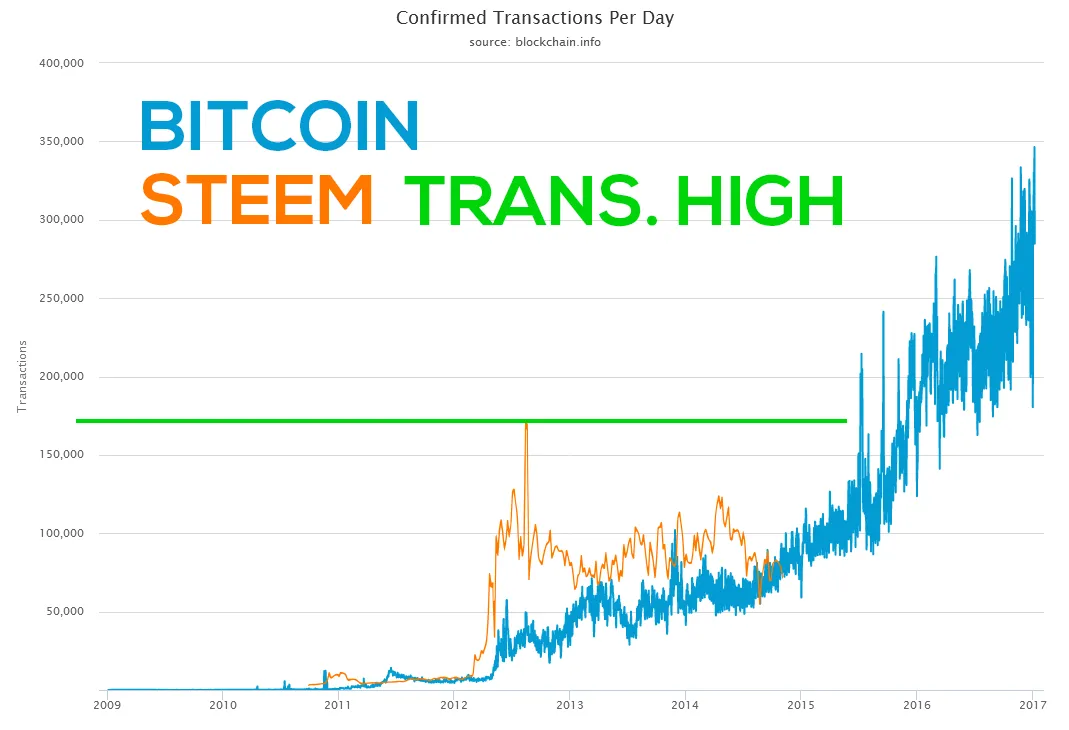
To me, that looks a bit more accurate considering the transactions levels match more. But the other one was more a start-up time frame, so it might match more.
Anyways, what do you think? Does this indicate where we are going? It's all just speculation, but it's a bit of fun to fantasize and dream about what we think is going to happen to Steem :P
Bonus, Steem's post only (no comments) activity level mainly coming from Steemit.com:
Well that's it for the charts and comparison.
Who knows what the future holds. But personally, it looks promising to me :)
What do you think?
References:
https://blockchain.info/charts/n-transactions?timespan=all
Thank you for your time and attention! I appreciate the knowledge reaching more people. Take care. Peace.
If you appreciate and value the content, please consider:
 me for more content to come!
@krnel
2017-01-08, 7:15pm