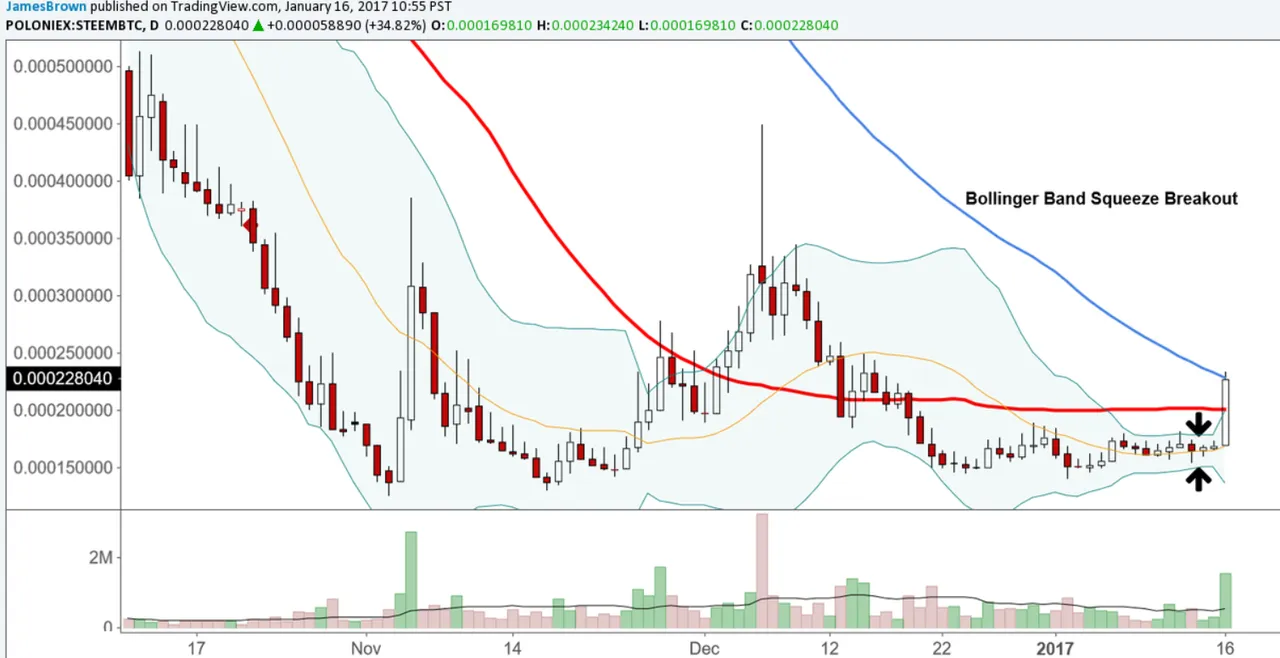
Steem's price is testing the 100 day "simple moving average" (DSMA), right now! ...like, for the first time in, well, ever. That thick blue line that the price is current resting on is the 100 DSMA. Price busted through the 50 DSMA without any hiccups (red line) - that's a bullish sign, fellas!
Looking at it from a purely technical perspective, this quick burst was likely the result of the 20 DSMA "bollinger band squeeze". Bollinger bands measure the 2 standard deviation range around a moving average. Tightening bands highlight periods when price is relatively low in volatility. The tighter the bands, the less volatile the market.
Typically, pressure will build in favor of one side of the market (buyers vs. sellers) during long periods of tight trading prices, as these moments allow for large, calculated accumulations/ distributions. This is where the "strong hands", or "smart money" quietly accumulate/ distribute in anticipation of the sellers/ buyers drying up.
And, when the big guys are right, the guys on the wrong side of the trade get eaten alive. That's what I think happened with Steem today.