
SUMMARY
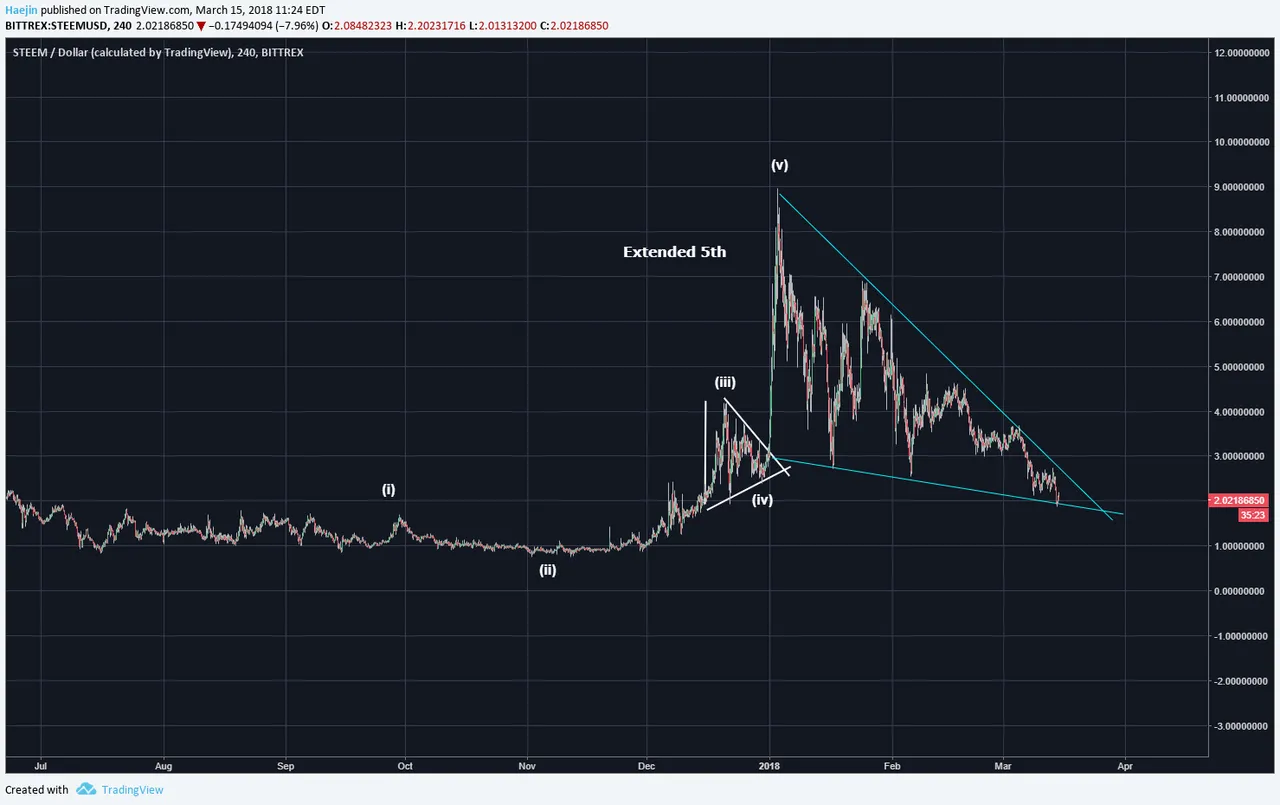
The triangle line has been updated to incorporate new price data as shown in below chart. It's been discussed how the extended 5th wave can have implications on the degree of retracement and thus far, STEEM has retraced to the prior wave (iv).
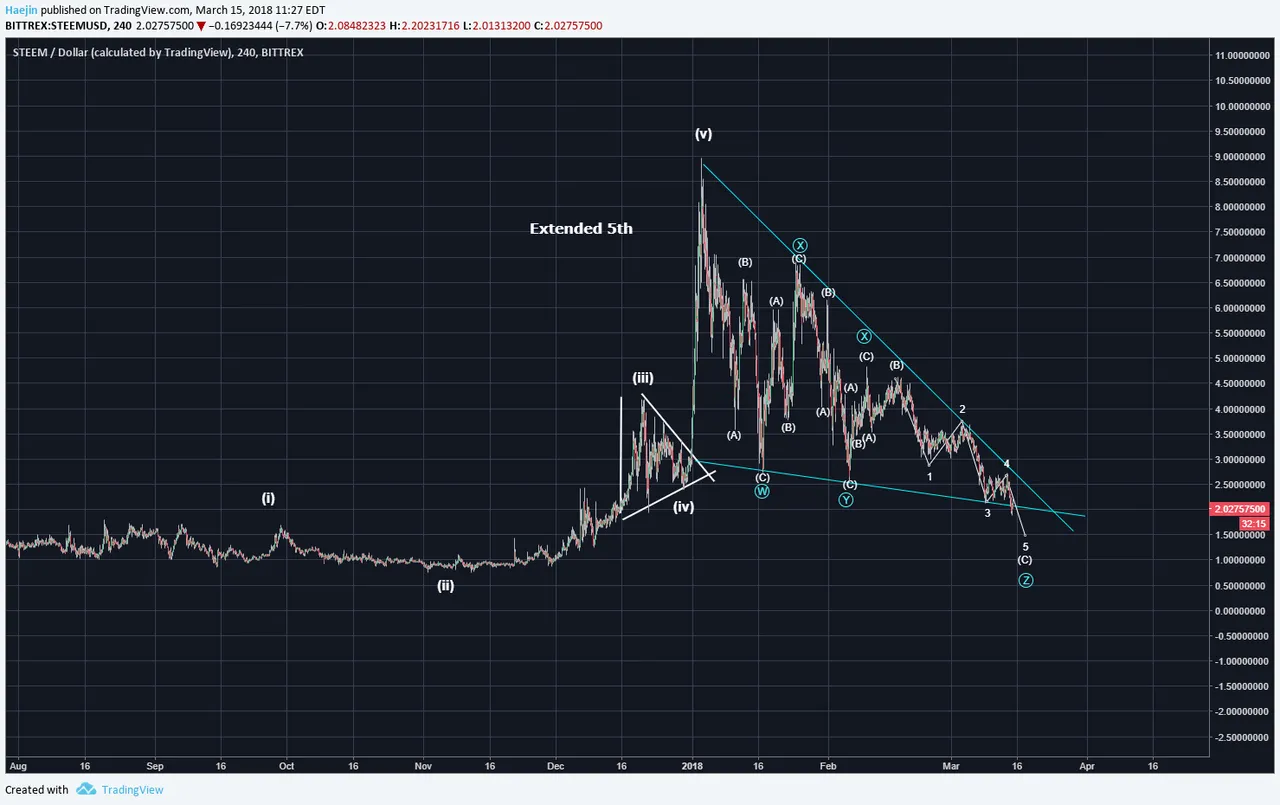
Elliott Waves show a complex triple fits better as shown in blue and the subwaves indicate that the correction should be near the terminal end. The blue Z is shown with the abc subwaves and the five of the c sem nearly complete! Some exciting price reversal is very likely soon.
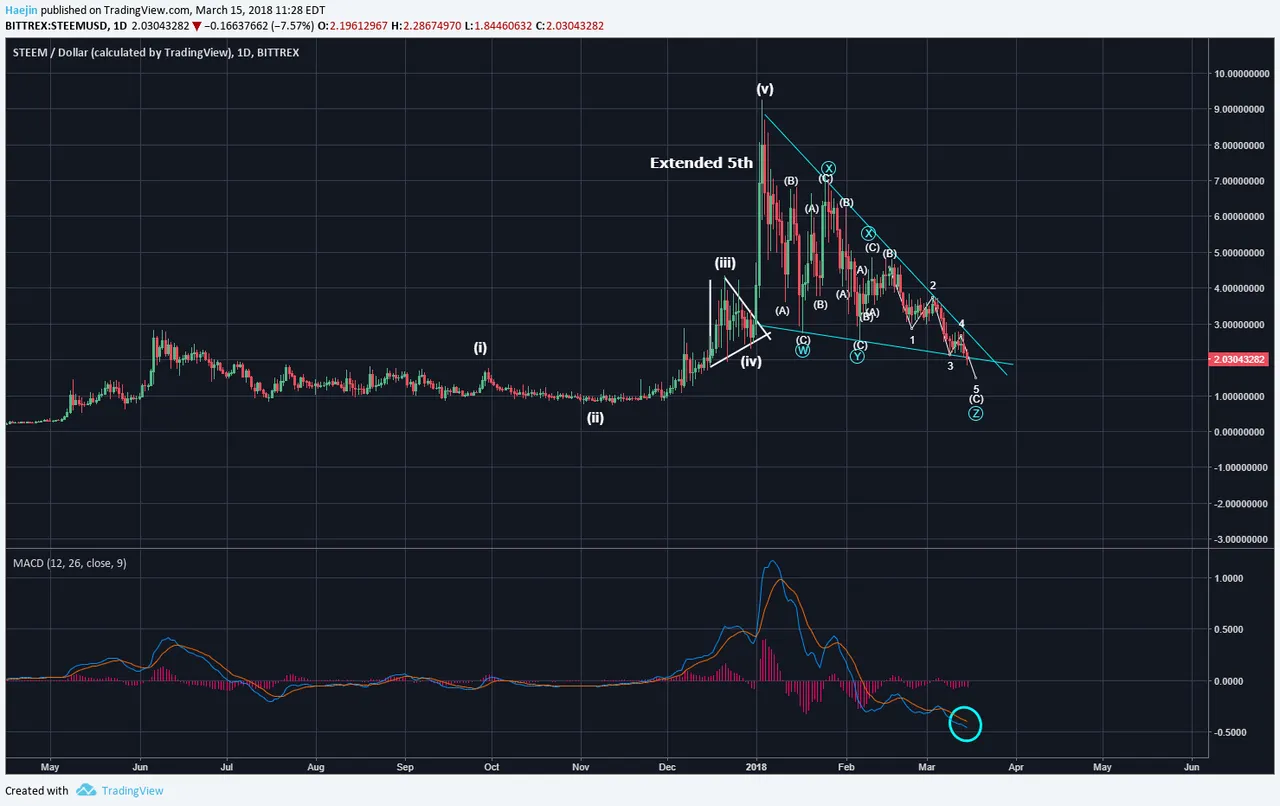
Here is the daily chart of STEEM and the MACD is showing oversold status that had been getting deeper since early February. If a turn occurs, it'll likely coincide with Bitcoin reversing out of its wedge pattern.
Legal Disclaimer: I am not a financial advisor nor is any content in this article presented as financial advice. The information provided in this blog post and any other posts that I make and any accompanying material is for informational purposes only. It should not be considered financial or investment advice of any kind. One should consult with a financial or investment professional to determine what may be best for your individual needs. Plain English: This is only my opinion, make of it what you wish. What does this mean? It means it's not advice nor recommendation to either buy or sell anything! It's only meant for use as informative or entertainment purposes.
Please consider reviewing these Tutorials on:
Elliott Wave Counting Tutorial #1
Elliott Wave Counting Tutorial #2
Elliott Wave Counting Tutorial #3
Laddering and Buy/Sell Setups.
Laddering Example with EOS
Tutorial on the use of Fibonacci & Elliott Waves
@haejin's Trading Nuggets
Essay: Is Technical Analysis a Quantum Event?
Follow me on Twitter for Real Time Alerts!!
Follow me on StockTwits for UpDates!!
--
--

