SUMMARY
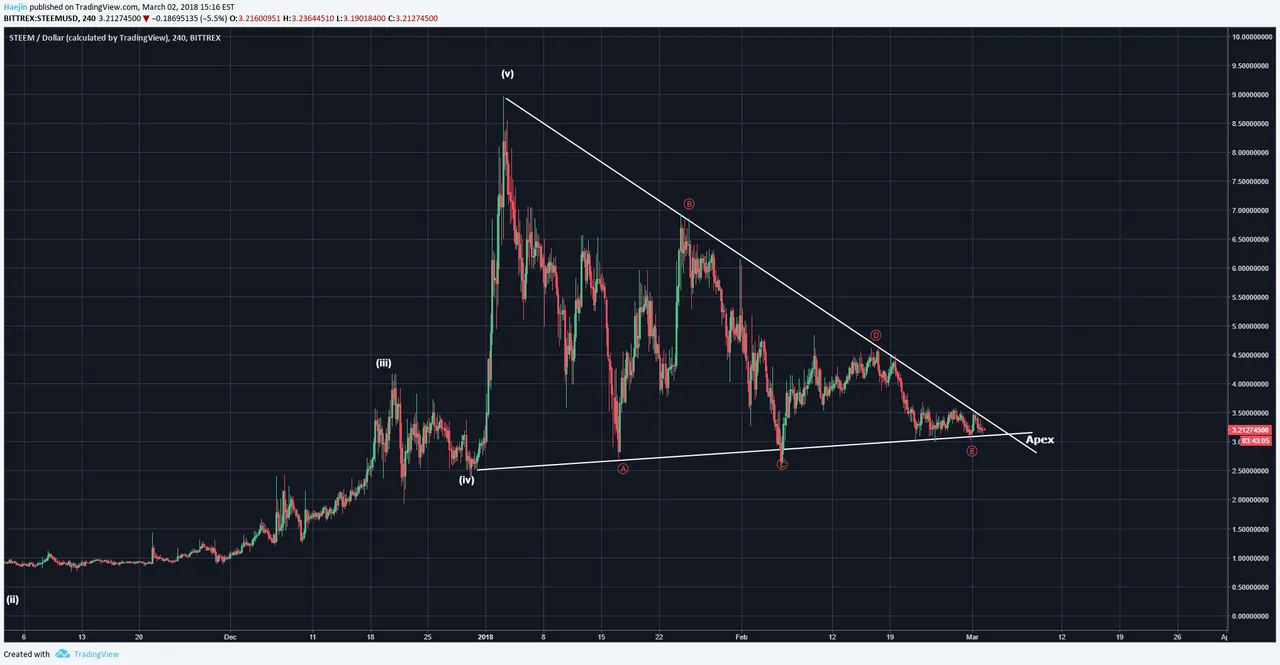
Are you feeling down that STEEM isn't yet sharing in the uptrend glories of Bitcoin's rise? My analysis shows that the price future for STEEM can be unbelievable. Here is why, the below chart shows a triangle where price is ever so close to the Apex; the point at which the two triangle lines intersect. This has been the final pattern likely selected by STEEM to finish off it's near 3 months correction. Such close proximity of price to the apex usually results in explosions...upwards!
The fractals of the blue and white triangles are amazing! IF the white triangle proportionally exploded as much as the the blue fractal #1; where would the price be? Remember, fractals are only one of many components of analysis and gives no guarantees but only analytical perspective.
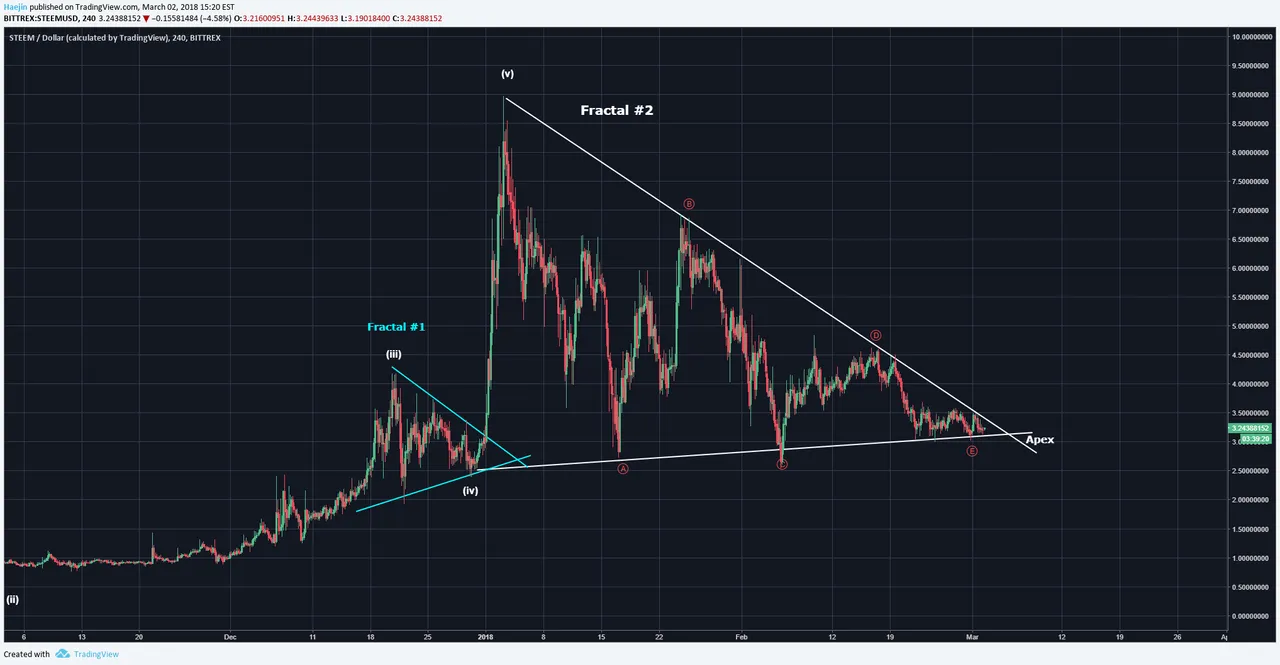
IF this analysis is correct, STEEM could target $22.06 by November of this year. That explosion of price out of the current symmetrical triangle is the final comfirmatory step needed. It could happen overnight! I measured the widest width of Fractal #1 and since price exploded 3x the width; I've overlayed the same for Fractal #2. In a later update, I will overlay the Elliott Waves.

Look at the MACD daily. It's like screaming to explode! Look at the prior similar MACD conditions...it's very bullish!

Legal Disclaimer: I am not a financial advisor nor is any content in this article presented as financial advice. The information provided in this blog post and any other posts that I make and any accompanying material is for informational purposes only. It should not be considered financial or investment advice of any kind. One should consult with a financial or investment professional to determine what may be best for your individual needs. Plain English: This is only my opinion, make of it what you wish. What does this mean? It means it's not advice nor recommendation to either buy or sell anything! It's only meant for use as informative or entertainment purposes.
Please consider reviewing these Tutorials on:
Elliott Wave Counting Tutorial #1
Elliott Wave Counting Tutorial #2
Elliott Wave Counting Tutorial #3
Laddering and Buy/Sell Setups.
Laddering Example with EOS
Tutorial on the use of Fibonacci & Elliott Waves
@haejin's Trading Nuggets
Essay: Is Technical Analysis a Quantum Event?
Follow me on Twitter for Real Time Alerts!!
Follow me on StockTwits for UpDates!!
--
--

