
With all the markets down the past week or two, I have been sitting on the sidelines waiting and preparing. There are a lot of tempting charts this week, with a few coins nearing their key resistance levels. One of those is STEEM!
Show me the chart!
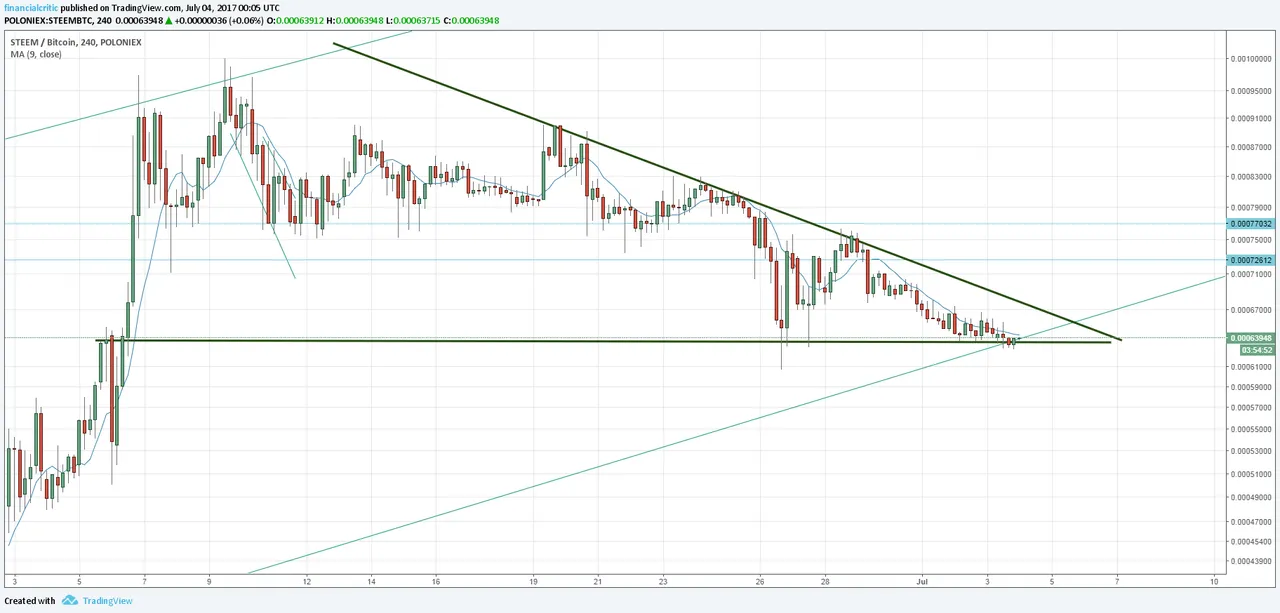
This is a 4 hour chart, going back one month. We are nearing the end of a triangle pattern. Steem can either go up or down from here.
Why am I so bullish after seeing the triangle nearing it's end?
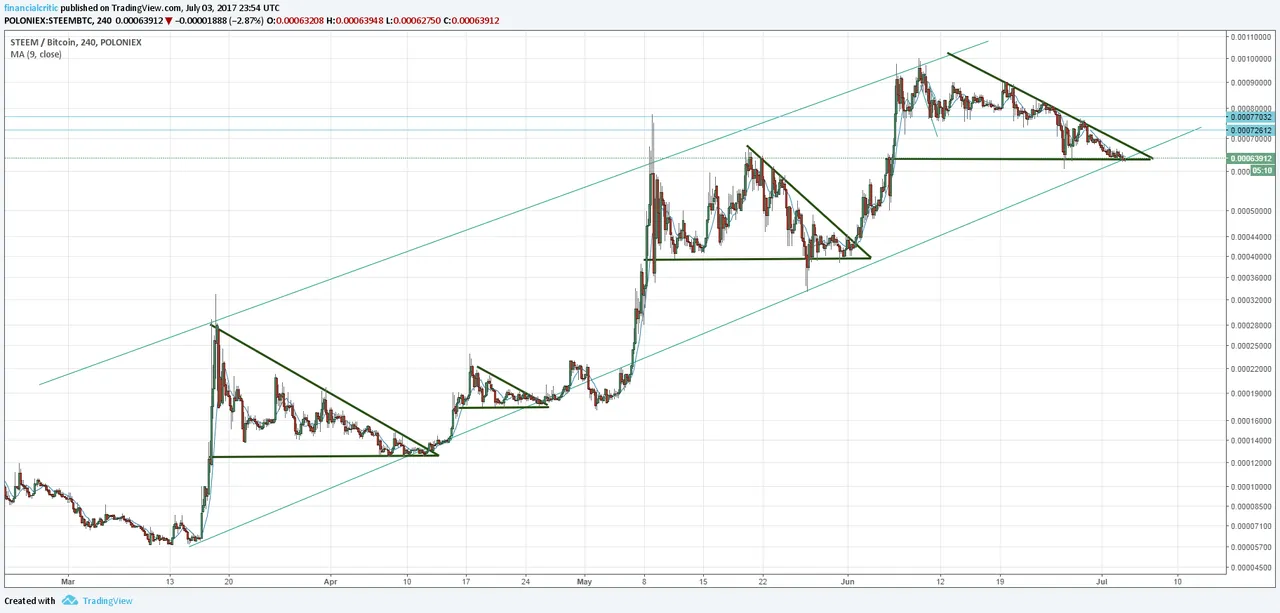
This is the 4 hour chart going back 4 months. We have seen triangles before and Steem has popped each time.
What about fundamentals?
Fundamentally, nothing has changed over the past few months.
- Alexa ranking has climbed to 4,970 globally and 1,399 in the US
- Number of Steemit users has more than doubled in past 6 months
- Post and Comment count has doubled in just the past month
- Active users has quadrupled in past 6 months
Steemit Stats courtesy of @arcange